Many firms struggle to meet the obligations necessary to stay in business. When struggling to keep the lights on, many businesses overlook marketing, especially market research. This is a huge mistake because marketing is the only pathway to success since you can’t pay any bills if you don’t provide products that solve consumer problems and deliver them at the right price, right time, and the right place. Plus, you must use messaging that convinces prospective buyers of the value represented by your brands.
A first step is building a deep understanding of your customers;
- what they want
- where they shop
- how much they can afford
- which attributes are most important in making a purchase
- how to frame messaging and where to post messages
Market Research
Market research is especially easy for firms to overlook in tough times. However, marketing is the key to ensuring the long-term success of your business, and economic downturns often provide unique opportunities for firms to:
- stand out from the crowd
- introduce innovative products
- to capture market share
Market research allows a firm to track changes in consumer attitudes, needs, and ways of interaction. Managers might use internal data(such as scanner or clickstream data), data mining of other databases, or maybe more traditional survey or experimental data. Whatever the technique, market research provides direction to help your business stand out with your target market.
Research also comes from your social networks and other digital marketing efforts by tracking what folks say in their posts — what are their pains, what kinds of things really excite them, how they live their lives.
You can implement market research in a number of ways including traditional market research, qualitative research, social media listening, and secondary data collection (including both internal and external data).
Conducting Market Research
Conducting research isn’t really all that hard and you don’t even need a formal process sometimes. You might just strike up a conversation with customers in your store or on your social networks, for instance. Or, you might choose a formal research process, which we discuss later. You might analyze data from sales or collect secondary data such as forecast growth for your market.
So, is traditional marketing research dead? Not by a long shot, despite reports of its demise. Understanding customers may have shifted but it’s no less important today than in the past.
Celebrating the death of traditional market research
Digital folks and marketers who probably never appreciated the role of understanding customers in success, may want to think research is dead. And, it does have some problems, especially when implemented by hacks. For instance,
- lag in getting actionable insights
- lack of reliability and validity
- better as a rearview mirror than a crystal ball
Lag in getting actionable insights
Traditional market research is too slow for today’s business markets where things change over the course of the day. Taking weeks or months to get answers to your pressing business questions may not work. Today, firms sometimes use real-time data, using insights to make changes on the fly. The command center below guides NASCAR as they determine how to optimize broadcasts for engagement.
Lack of reliability and validity
Industry market research is notoriously low in both reliability and validity. Reliability means you can redo the survey and get the same results. Validity means the answers you get to answer the questions you asked. The basic problem here isn’t with market research but with entrusting people who don’t understand reliability and validity.
You can test reliability by using multiple items that measure the same thing. Let’s say you want to see how satisfied customers are with their recent purchase. You might ask them how happy they are, how satisfied they are, and would they make the purchase again. See how you’re asking the same thing in different ways. If respondents answer the same to all these questions, your survey is reliable. Increasing reliability requires getting to know how customers talk about satisfaction, ensuring the questions are free of bias, etc.
Testing validity is MUCH harder – so we’re not going to talk about that here. Let’s just say that most consumers don’t come with a gauge installed telling them HOW satisfied they are on a scale of 1-10 and if they’re having a bad day, they’re less satisfied than if you ask them the same question on a good day. You can get around this problem by using other means to help respondents such as giving them a temperature gauge or a picture to express satisfaction.
Lack of predictive power
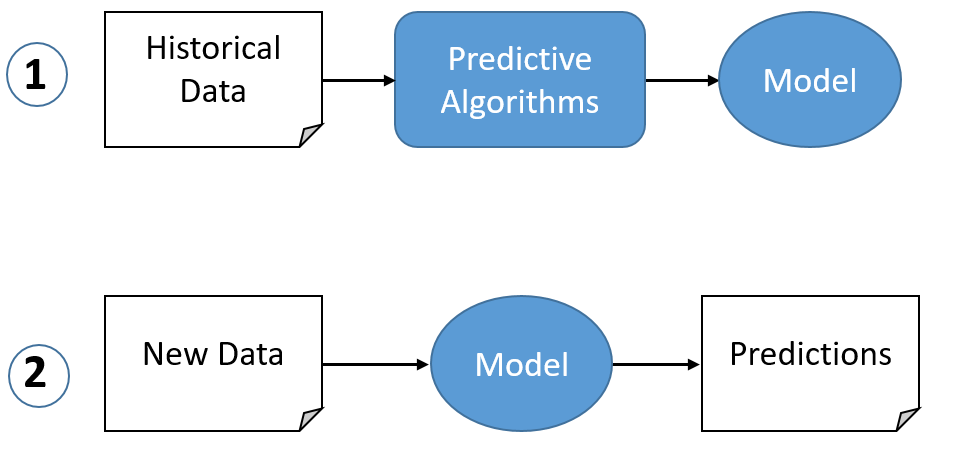
Like I said, traditional market research does a better job of telling you what happened rather than what’s going to happen. You fix that by understanding the range of factors impacting behavior then building models to predict future behavior using the process below.
Unfortunately, many surveys focus on attitudes, which are really important but are often poor predictors of behavior. That’s what makes them poor predictors. A group of students once did a survey for a planned aquarium to see whether it was feasible. Findings suggested a sufficient number of visitors would pay a sufficient price to visit the aquarium. The city went ahead with its plans but failed to capture the necessary revenues. Attitudes are poor predictors of behavior.
When to do market research
The time to do market research is when your ideas are in a fairly nascent stage before you spent a lot of money on them. Once you have a prototype or are ready to launch the product, it’s too late because you can’t implement changes easily. You need feedback from your target market early and often in the design process to answer the following questions:
- Who is your target market and what do they need?
- Does the product address a real problem faced by your target market?
- Do a sufficient number of people or organizations have the need, money, authority, and desire to solve the problem?
- What do competitors offer and how can you differentiate your product from theirs in a substantive way?
- What features should you offer? Which features are consumers willing to pay for?
- What should your product look like?
- What are the claims that will resonate with your target market?
- How much are members of your target market willing to pay?
- Where would they anticipate buying your product?
- What challenges would they face in buying and/or using your product?
Not only is market research important in the early stages of product development, but periodic market research also lets you know where you stand, answering questions like:
- What share of the market do I have?
- Which marketing activities contribute most to my sales? Which contribute the least? Which produces the highest ROI?
- How are competitors marketing their brands?
- Are there changes in my target market or the population that offer opportunities or threats?
- What can I do to increase my market share?
Problems creating poor insights
Image courtesy of ExasolAG
We’ve all heard horror stories of market research gone wrong.
How do you avoid these problems?
Hiring an experienced market research agency or experienced in-house researchers is important. Otherwise, your market research does more to confirm biases than guide decision-making.
Here are some dangers to watch out for:
1. Wrong sample
In my experience, firms too often use a sample that’s convenient rather than one that’s going to give valid information. If you ask salespeople what customers want, you’re going to get something very different from asking customers themselves.
So, your first task is to identify a valid sample. While I’m not convinced that a random sample is the end-all sampling technique, you need a good reason for not using it. For instance, I once did a study on buying pharmaceuticals on the Mexican-side of the US border. We stood on a bridge between the 2 countries and asked questions of every Nth person crossing the bridge. Sure, this wasn’t truly a random sample, but there’s no reason to believe that folks crossing other bridges or on different days were systematically different from the ones we surveyed. Alternatively, selecting a random sample from a list would have been challenging since we wouldn’t find many who did this cross-border shopping.
Meanwhile, I heard a colleague touting her random sample until I pointed out that her demographics didn’t match Census data, suggesting bias in her sample.
Chief take-away: ask the right people and use an unbiased method of choosing members of the sample.
2. Too small a sample
Most of us remember taking Stats in H.S. or college. We hated the formula for calculating sample size because it relied on variance, which we didn’t know, in many cases, until we’d analyzed our sample. That said, I think we can all agree those polls in the newspaper are seriously flawed when they use a sample of 200 to project anything about the US with a population of over 300 million. It’s just too small.
But, do you need 20% of the population to be valid? Or 10%?
My guess is you need a minimum of 5-10% of a B2B population and about 20% of a consumer population. But, that’s just a guess. In a nationwide sample, quota sampling solves the problem of needing huge samples.
Chief takeaway: you need a sufficiently large sample of a population to capture the variability within the population.
3. Ask the right questions
It may seem obvious, but asking the RIGHT questions on your survey is really important to get good market research. That’s why you need to know something about your customers/ prospects before you even begin the process. And, don’t ASSUME you know what your customers want — ask them.
Often, I’ll use some interviews or a focus group to help me understand what’s important to customers. I once did a project for a B2B manufacturer to see what customers wanted. We did a number of interviews and a couple of focus groups first. These suggested prospective customers were most interested in the reliability of the product. But, the company was only interested in what features customers wanted, so the survey was limited to asking how many wanted each potential feature. The company then added the features most wanted by customers, despite our report stating customers most wanted reliability, not more bells and whistles. The company made its product, but it didn’t sell well because it didn’t give customers what they REALLY wanted — reliability.
Chief takeaway: Ask questions related to the key decision variables consumers use.
4. Avoid bias
I was taught to use multi-item scales for data collection. That might not always be possible, but too few practitioners even know about scaling or constructs, or other issues related to how you ask questions.
By the same token, they ask double-barreled questions, questions that no real person could answer correctly, or questions that lead to a specific answer creating bias. Multi-item scales are designed to reduce these problems.
We’ve probably all come across surveys that fall into the category of “bad questions”. Maybe they ask about things you didn’t experience and don’t give you the option to not answer the question, so you enter 
Coke’s mistake in developing New Coke follows a similar pattern — they assumed sweetness was the determining factor in purchase and set out to create a product matching the exact level of sweetness desired by consumers. The product was a dismal failure because consumers use other criteria in deciding which brand of cola to purchase. In the Coke mistake, they asked about sweetness when that wasn’t a determining factor in deciding between Coke and Pepsi.
Chief take-away: ask questions in a way that provides valid, unbiased answers.
5. Do the right analysis
Planning for the right analysis starts when you’re crafting the questions. For instance, I once suggested to a client they needed conjoint analysis to answer their problem — a survey technique that provides guidance in terms of what features customers are willing to pay for. They had already constructed the questionnaire so they didn’t want to go back and redo it. Once the data was analyzed, they asked me which features to put into the new device and I didn’t have the data to answer them.
Chief takeaway: determine what questions need an answer, then construct the survey to provide that type of data.
6. Interpretation matters
The most critical element of a market research study is interpreting the data; what does it mean for our organization; how does it impact our decisions.
And, there’s no shortcut in this. You need someone intuitive, someone who understands your company and its needs, someone who knows how to use the data to its fullest advantage. For instance, I was once analyzing a large dataset. Some aspects didn’t fit my initial feelings about the situation. That lead me to dig deeper and I realized 1 variable hadn’t been recoded properly. Once we fixed that, the data told the story I’d expected after a series of qualitative preliminary studies.
OK, this is where your statistics professor was right – there are lies, damn lies, and statistics. In fact, Ross Perot was so good at creating misleading statistics, he almost derailed efforts to approve NAFTA. So, here’s some advice:
- Correlation does NOT equal causation – the classic example of this is women’s hemlines, which tend to lengthen in economic downturns and shorten in periods of economic plenty. Of course, hemlines don’t fix economic problems (although it would be nice if that worked because all we’d have to do to get out of this economic slump is wear shorter dresses). By the same token, economic conditions don’t affect hemlines — it’s not like designers get nervous about the economy and lengthen their designs. It’s really a function of a 3rd element — which is psychological. When people get stressed about economic conditions, they tend to be more conservative — with their money and, obviously, with lifestyle elements such as hemlines. Of course, this has serious implications for the election later this year, but I refuse to get into politics on this blog.
- Scale matters – and Ross Perot as a master at this. If you blow up the graph big enough, even small changes looked impressive. That’s why your professor stressed the statistical significance represented by differences and why you should also look at practical significance.
- Statistical significance is a measure of the degree to which 2 values are truly different from each other and it’s a complex mathematical function beyond our scope and something taken care of by most statistical analysis tools, such as SPSS. Let’s just say that it’s impossible to eyeball 2 numbers to tell if they are truly different from each other, so when you graph them, especially on a really tiny scale, it’s easy to assume a difference that doesn’t exist. So, with NAFTA, Ross Perot showed graphs blown up so that really small differences in current results and projected results after NAFTA looked very different when, in fact, they were nearly identical — which has proven true after approval of NAFTA.
Courtesy of Information Management
Practical significance looks at whether something really leads to different results. So, something that leads to a 3% increase in customer satisfaction may NOT have a measurable impact on a company’s bottom line — since satisfaction is only 1 element leading to sales of a product. But, a 3% decrease in price might have a much more substantial impact on sales. Obviously, the firm would make the changes leading to a price decrease before making changes leading to increased customer satisfaction.
Visualizing data helps improve and ease interpretation.
Chief takeaway: interpretation is part art and part science.
A few final caveats:
- Don’t assume a single study is all that’s necessary. Often, combining a qualitative and quantitative study provide superior results.
- Just because you have a hammer doesn’t mean that’s the right tool for every job. Sometimes you need a different tool to get at the right result.
- Unlike finance, market research is probabilistic. That means you’re getting results in terms of what’s most likely to happen, but it’s not always what WILL happen.
- Knowing something doesn’t mean it will be true from now until forever.
- Doing market research to support what you already know is bad market research.
Alternatives to traditional marketing research
Thankfully, there are good alternatives to traditional market research:
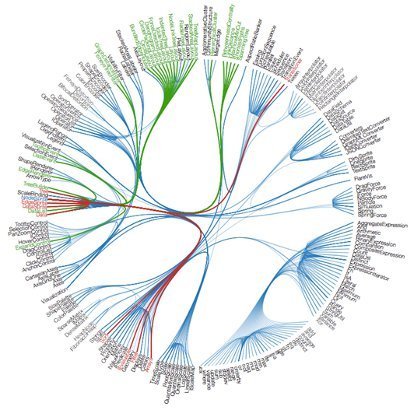
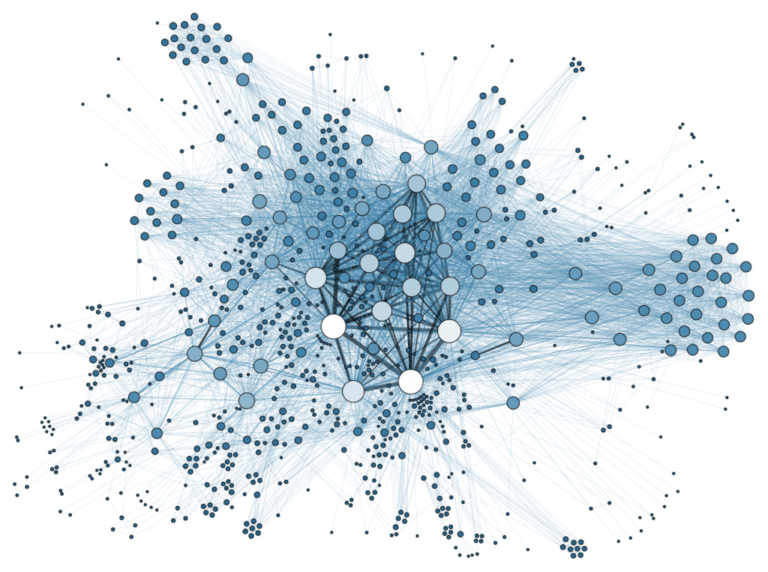
Analysis of big data
Analysis of big data is all the rage right now. Big data analysis involves analyzing massive datasets consisting of both structured and unstructured (words, images) data to mine for insights. Commonly implemented using relational databases (with a key to connect data) and specific analysis techniques designed to analyze such massive datasets. Data come from social media, IoT (the internet of things), internal databases such as transactional databases, mobile devices, sensors like beacons, web analytics, and recordings from customer service calls.
Big data analysis often uses tools discussed earlier, such as predictive analytics and data visualization while including AI/ ML (artificial intelligence and machine learning), data mining, NLP (natural language processing), and other tools. This type of analysis requires specialized software and languages such as Python.
LISTENING
Social media and other forms of digital marketing provide a great tool for listening.
Image courtesy of Lumen Learning
Whether you’re interested in assessing sentiment (satisfaction) or uncovering unmet needs and problems, you can often find the answers by listening to what’s being said by real people on social networks, blogs, and online forums.
For instance, I did a project examining comments left on the Disney forum about Disney resorts and parks. One finding showed that visitors were most interested in how close the tram stop was to their room at the resort. The recommendation was as simple as adding more tram stops throughout the property to increase satisfaction.
Likely, a traditional marketing survey would never think to ask about tram stops in assessing how to increase satisfaction with the resort properties.
In our earlier post on this topic, we discussed some basics of market research; why it’s important, optional methods, etc. Today, I want to expand on these basics to give you a deeper understanding of how to do GOOD market research.
Teaming market research with social media
As reflected in this infographic from PageModo [see the bottom of the post], market research on social media is a winning combination — whether you’re doing problem-oriented market research or gathering routine market intelligence.
That’s because your social network is a ready-made pool of engaged consumers who are likely already part of your target audience — likely they’re already customers.
Here are some of the ways you can use your social networks for market research:
- Understand the lived experience of your customers. This is academic-speak for developing a deep understanding of your target audience and how they live their lives. What are their biggest problems? What brings them joy? What do they value most? Who are they influenced by? How do they express themselves? You get the idea.
- Ask them. I particularly love the ability to ask questions on Facebook and other platforms that allows you to build engagement with and extend your social network by asking questions. These answers also help you understand what’s important to your target audience or discover unmet needs to uncover market opportunities.
- Test market. Social networks are great for test-marketing new ideas before you spend the money to create a new product or service. Float your ideas on Facebook, Twitter, LinkedIn, etc to see what folks have to say about the idea. Do they Like it? Share it? This can save you millions, especially if they suggest improvements to your design.
- Sentiment analysis. Knowing what folks say about you and your brand is important. Quick response to service/ product failures, advertising mistakes, or even social media gaffs can reduce the impact of this negative sentiment on your brand image. Fixing problems in the public forum of social media can even provide lift for your brand. Sentiment analysis should include not only monitoring on social networks, but more in-depth monitoring using Google Alerts (FREE) or paid solutions, such as Radian6.
- Determine what works and what doesn’t. By tracking how consumers respond to your content — Liking, Sharing, Commenting — you can determine what content “works” for your target audience and what doesn’t (the same is true by tracking online performance using Google Analytics). This allows you to create more of the content that works and improves the success of your social media marketing strategy.
- Use social media to promote your traditional market research. Traditional market research surveys still have a place in improving your understanding of your market and its needs. Using social media as a means for soliciting respondents is a cost-effective way to get the responses you need while increasing responses from your target audience.


