This year LinkedIn released new company page analytics to help marketers and business owners better understand their page engagement. LinkedIn’s new analytics allows companies to understand how their posts are performing, identify trends and learn more about their followers.

LinkedIn added a new tab to their company pages labeled “Analytics” that provides in-depth metrics about company pages, much improved from their previous analytics. We’ve provided an explanation of what these analytics mean and how you can use the data to improve your marketing and content.
Individual post data
The first section of the Analytics shows the most recent posts on your company page. For each post, the table shows the date it was posted, the audience it was shared with, if it was sponsored, the number of impressions, clicks and interactions, followers acquired and percentage of engagement. “Followers Acquired” only populates if you run a paid ad campaign and reports how many followers you gained from the campaign.
For marketers, the most important data in this table is the number of clicks, interactions and engagement percentage. Interactions include any time a follower liked, shared or commented on a post, which shows how followers are engaging with your content and what type of content they like. From this you can adjust your future content to include more of the types of posts that tend to be shared and clicked on.
Reach
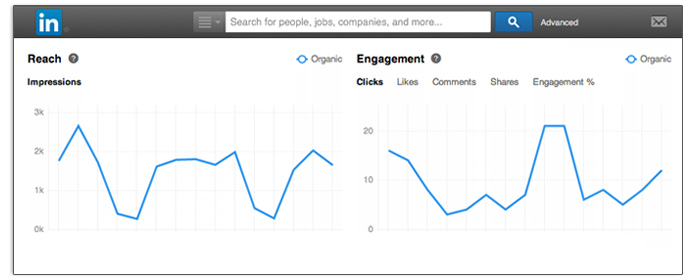
The next graph on the Analytics tab shows the number of total impressions your posts have on a daily basis. It also shows the number of unique people that saw your company updates. By hovering over the graph, you can see the date of the peaks and troughs. Comparing this to what your post was that day can reveal which posts are most interesting for your followers. Don’t forget you can also change the date range to see posts from further back.
Engagement
Engagement is one of the most important data metrics to track and analyze. The engagement graph on LinkedIn measures the number of clicks, likes, comments, shares and engagement percentage for your posts over a specified date range. It can also track how many followers you acquired if you run a paid ad campaign.
For marketers, one of the most important columns is engagement percentage. By looking at your top posts with the highest of percentage of engagement, you can get a good idea of which posts are the most popular and are more likely to be shared—allowing your to tweak the content your share moving forward.
Follower demographics
In the Followers section of the analytics, you can see a breakdown of who is following your company by seniority, industry, company size, function, and employee. This information is important because you can target your posts to certain demographics. By understanding who your audience is, you can create more relevant content that will relate to your audience.
Follower trends
The follower trends graph allows you to see how the number of followers of your page has changed over time. Most companies will see a steady increase in followers as they begin to post consistent, engaging content. LinkedIn also allows you to compare your company to its competitors to provide a benchmark and goal for your marketing. Analyze the graph to see if there was a specific date that significantly increased your followers and see what content inspired this action.
Tips for improving your LinkedIn company analytics
Here are a few tips to improve your company’s metrics:
– Post engaging content at least once per day
– Include photos or videos to increase engagement
– Encourage employees to share your company updates—they are your best endorsers!
– Target some of your posts to a specific audience
With over 3 million business pages, LinkedIn is one of the most popular social networks for companies. It’s important for marketers to understand the analytics in order to improve content and increase engagement and followers. By continuing to improve your company page, LinkedIn can become a powerful lead generation tool.
