Stats and analytics are the backbone of any good marketing campaign. If you are not using these to plan and review your campaigns, now is the best time to start! Even if your marketing strategy is done, it does not hurt to always look at it and change things as the year progresses based on the results you see from your current campaigns.
While reading through stats from the past year, these are the ones that stood out as being some of the most interesting.
Here are 36 marketing stats to keep in mind this year.
Digital Advertising Stats
Ad blocking in the US has increased from 15% to 30% since 2014. (Source: Statista)
60% of consumers click on mobile ads at least weekly. (Source: Business Wire)
Facebook Stats
100 million hours of video is viewed daily on Facebook. (Source: Facebook)
40% of consumers watch the most video on Facebook. (Source: Sprout Social Index 2018)
Instagram Stats
Within 10 hours of an Instagram post, users receive 50% of their total comments. (Source: Sprout Social)
Instagram posts using at least one hashtag receive 12.6% more engagement than posts excluding them. (Source: Sprout Social)
Instagram drives the most engagement per post compared to any social network–84 times more than Twitter, 54 times more than Pinterest and 10 times more than Facebook. (Source: Sprout Social)
7 out of 10 hashtags on Instagram are branded. (Source: Sprout Social)
51% of consumers used Instagram regularly, and more than half of those people (30%) like or follow a brand. (Source: Sprout Social Index 2018)
Millennial Social Media Stats
80% of millennial Pinterest users say that the platform helps them decide what they should buy. (Source: CoSchedule)
7 in 10 Gen-Xers are more likely to make purchases from brands they follow on social. (Source: Sprout Social)
50% of millennials use the internet to research products before purchasing. (Source: Marketing Sherpa)
Twitter Stats
Tweets with images are 150% more likely to get Retweets than text-only Tweets. (Source: AdWeek)
Twitter is accessed through a mobile device by 82% of its monthly active users. (Source: Sprout Social)
Tweets with videos get over six times as many retweets as tweets with photos. (Source: Wochit)
Search Marketing Stats
90% of searchers haven’t made up their mind about a brand before starting their search. (Source: Status Labs)
Local searches lead 50% of all mobile users to visit stores within one day. (Source: Google)
Over 51% of smartphone users have discovered a new company or product while searching on their smartphone. (Source: Google)
Organic SEO is about 5.66 times better than paid search ads. (Source: New Media Campaigns)
70-80% of search engine users are only focusing on the organic results. (Source: MarTech)
72% of consumers who did a local search visited a store within five miles. (Source: Wordstream)
Social Media Stats
59% of Americans believe that customer service through social media has made it easier to get their questions answered and issues resolved. (Source: Lyfe Marketing)
96% of people talking about companies and brands on social media aren’t actively following those brands. (Source: Lyfe Marketing)
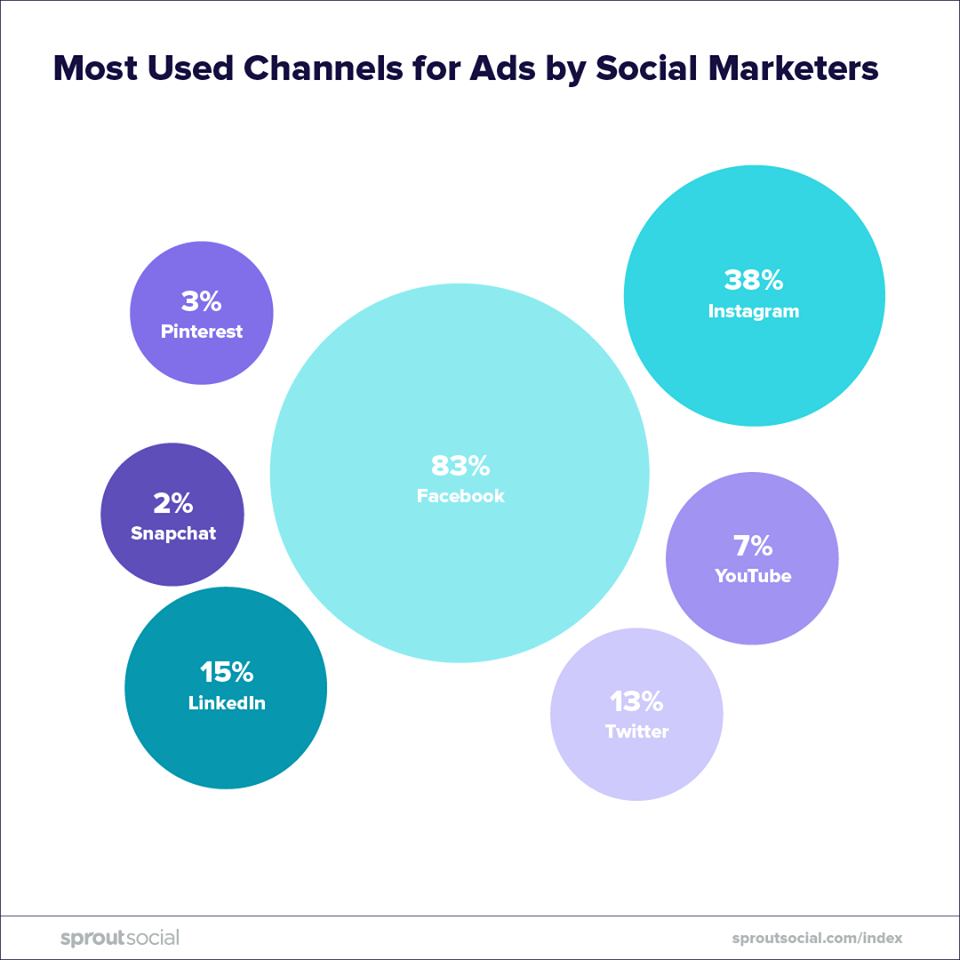
Facebook and Instagram are the choice platforms for marketers. (Source: Sprout Social Index 2018)
21% of consumers are more likely to buy from brands they can reach on social. The same percentage would rather message a brand on social media than call customer service. (Source: Sprout Social Index 2018)
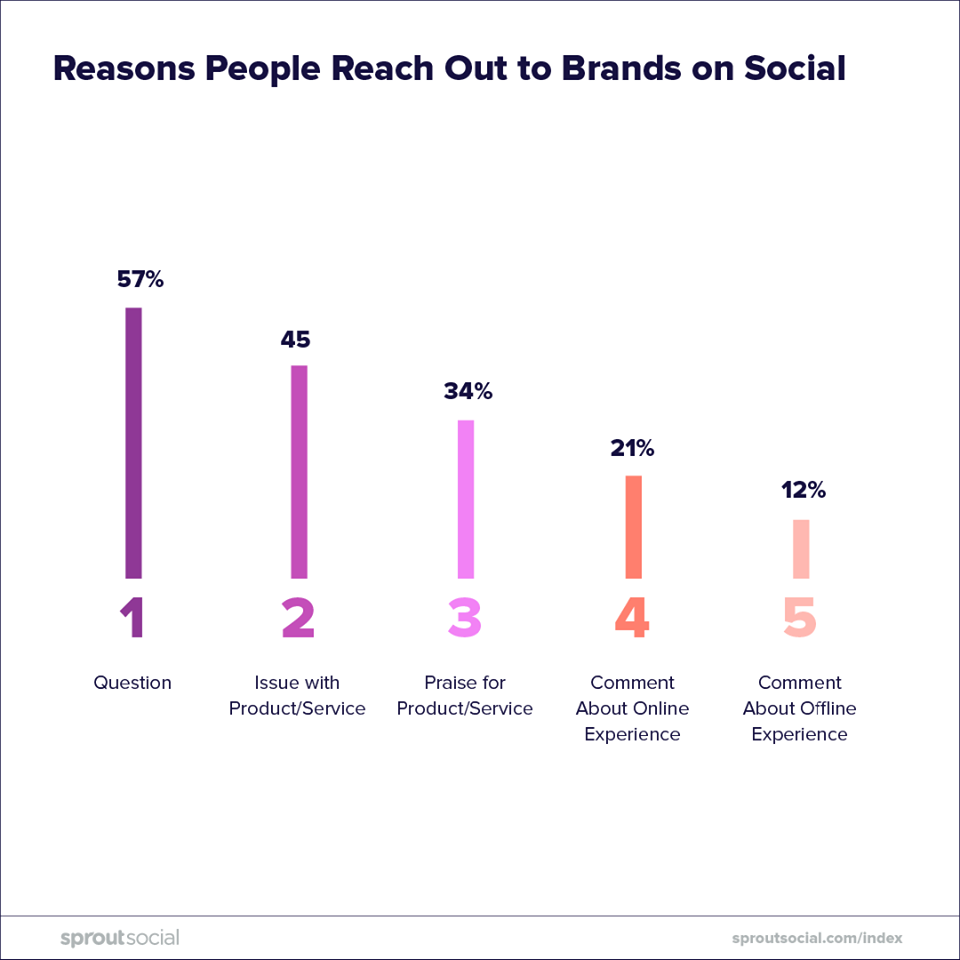
The top reasons that consumers reach out to brands on social are that they had a question (57%), they had an issue with a product or service (45%) or they wanted to commend a company on their product or service (34%). (Source: Sprout Social Index 2018)
Consumers absorb influencer content across the major social networks at a surprisingly low level, between 1-11%, and prefer seeing posts that announce what is happening at a company 3x more than company posts that feature influencers or celebrities. (Source: Sprout Social Index 2018)
When asked what their reaction would be if a friend posted about a company, product or service on social media, 61% of consumer respondents said they’d be more likely to research that product/service, compared to 36% if a product or service were mentioned by an influencer or celebrity. (Source: Sprout Social Index 2018)
Top factors that impact whether or not a consumer watches a video on social are length of video (61%), caption or description of video (51%) and whether the video is an ad or not (40%). (Source: Sprout Social Index 2018)
Over half of consumers (58%) prefer visual-first content on social media, with graphics and images and produced video taking the lead. (Source: Sprout Social Index 2018)
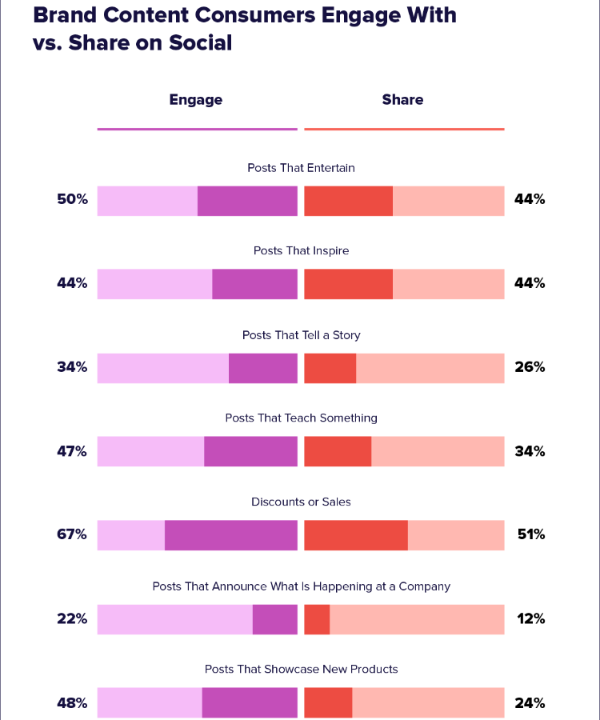
Consumers are more like to engage with posts that include discounts or are entertaining. (Source: Sprout Social Index 2018)
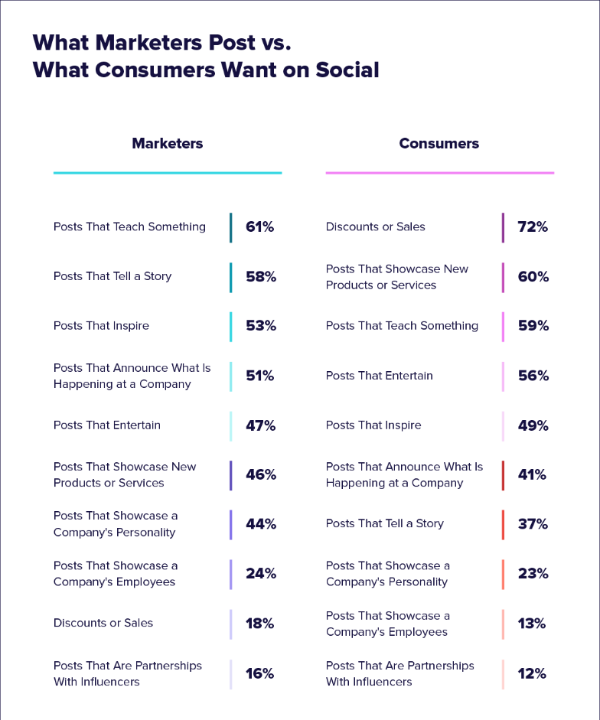
Consumers are looking for social content that includes discounts and sales (72%), posts that showcase new products and services (60%) and posts that teach them something (59%). (Source: Sprout Social Index 2018)
30% of consumers surveyed wanting links to more information from brands on social, and most preferring discounts, sales and educational posts. (Source: Sprout Social Index 2018)
Mobile accounts for nearly 80% of time spent on social media networks. (Source: Pew Internet)
Other Marketing Stats of Note
Emails that display incorrectly on mobile may be deleted within three seconds. (Source: Campaign Monitor)
LinkedIn posts with images receive 200% more engagement than text-only posts. (Source: Sprout Social)
Which stat surprised you the most?
