Storytelling is the watchword in content marketing.
To communicate with humans on an emotional level, you should tell stories using the same techniques that we all grew up with.
We learn from an early age through stories and there is a practical method to storytelling that you can employ in your content marketing. Read more about this on Marketing Week or Smart Insights. Also, LinkedIn created an infographic to track the rise of storytelling in marketing, using data.
Data storytelling is the art of telling brand stories using data visualisation and that’s what we’re going to cover in this article.
Key Takeaways: Harnessing the Power of Data Storytelling in Content Marketing
- Essence of Storytelling in Marketing: Emphasizes the critical role of storytelling in connecting with audiences on an emotional level, using familiar narrative techniques.
- Brand Storytelling: Focuses on crafting stories where the audience is the protagonist and the brand plays a supporting role, enhancing the narrative without being the focal point.
- Diverse Mediums for Storytelling: Highlights that storytelling transcends video and can be effectively accomplished through written content, infographics, and other formats, addressing the misconception that storytelling is synonymous with video content.
- Significance of Data Visualization: Introduces the concept of data storytelling, where data visualization is used to craft compelling brand narratives, engaging audiences with visually appealing and informative content.
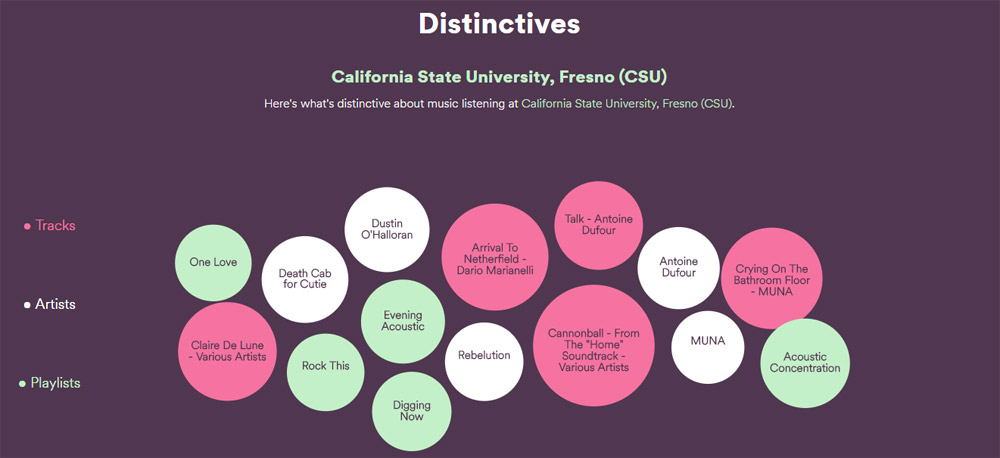
- Engagement Through Niche Audience Segmentation: Demonstrates the power of using data to tell stories that resonate with specific audience segments, as seen in Spotify’s approach to sharing insights on music preferences across different colleges.
- Personal Microdata Stories: Shows how personal experiences and data can weave engaging stories, offering a unique perspective on everyday life changes and patterns.
- Customer-Centric Data Stories: Encourages making the customer the centerpiece of your story, using data to highlight user experiences and interactions with the brand, exemplified by Airbnb’s user-driven storytelling campaign.
- Leveraging Public Data for Brand Narratives: Illustrates how unrelated public data can inspire brand stories that address broader societal issues, creating meaningful connections with audiences, as shown in Whirlpool’s initiative.
- Data Sourcing as a Foundation: Stresses the importance of gathering credible, comprehensive data as the first step in crafting a data-driven storytelling strategy, setting the stage for a compelling narrative.
- Future of Marketing with Data Storytelling: Projects data storytelling as a growing trend in digital marketing, merging creativity with analytics to produce narratives that are not only engaging but also informative and memorable.
Your Brand Story Should Resonate With Your Audience
Before we do though, let’s quickly take a look at ‘brand storytelling’.
This is about finding a story that resonates with your audience, where your audience is the hero and your brand is merely an essential character in the story.
To demonstrate that, here is just one example – a sweet advert about a relationship where Google just happens to make the difference.
The key thing to note here is that the advert is telling a story about the father and daughter rather than about the product.
Telling Your Story Using Data Visualization
Not everyone uses video storytelling, and this article is not about that. This is an important point to note – storytelling does not mean video. The two are not integrally linked.
You can tell stories with the written word, with infographics, with slide decks or in other formats. Most content marketing consists of the written word.
With more than two million blog posts being published per day on WordPress.com alone (seriously, check this counter), you need to be able to stand out from the crowd.
Not only that.
Each blog post only commands, on average, about 15 seconds of a person’s attention, according to this article from Time.
If you invest some time in research and planning to gather data insights, you can then add design flair to your content to tell stories in an engaging, visually appealing way.
There are two elements to this, which I will explain with some examples you can enjoy.
Finding a Niche Audience Segment To Create a Story
Let me share this example with you.
Spotify’s business model is to charge subscription fees for access to a global library of music. Its story could be all about which music you should be listening to.
But, it’s a data business, where algorithms track tastes and usage to make recommendations to users and help them enjoy the experience of being a customer.
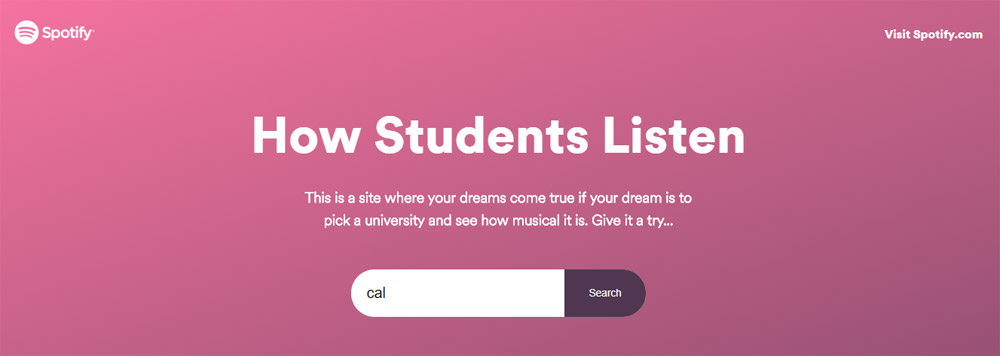
Being data-minded, Spotify uses its Spotify Insights blog to tell stories about how people use Spotify and what they listen to in different situations.
It could have just written this up into an article, but it uses data visualisation and interactivity to create a more engaging story.
Have a look at students.withspotify.com to see stats relating to Spotify users at different colleges in the USA.
You can select different filters like volume, runnability, tempo and more, to see how each university compares.
Even Personal Microdata Can Make a Good Story
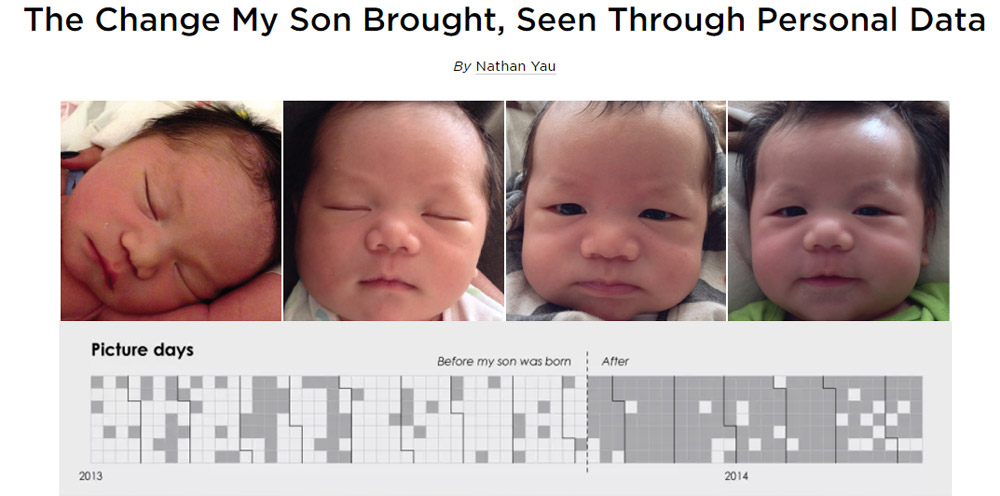
Statistician Nathan Yau tracked some personal metrics before and after the birth of his son, and he published the results in a blog post for Flowing Data.
He tracked sleep patterns, the number of photos he took each day and other statistics to create a series of charts, which tell a story, even without Nathan’s narrative.
Making Customer Data the Source of Your Story
Airbnb’s story is about helping people find their home from home when they are travelling. It could concentrate on city guides and descriptions of properties.
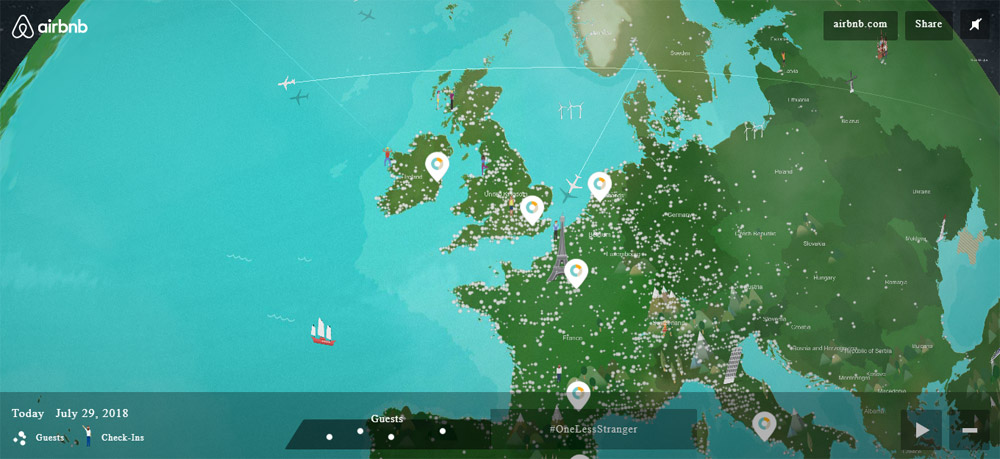
In 2014, it decided to make Airbnb users the story, by asking them to participate in a ‘random act of kindness’ campaign. The company combined data from this campaign as well as data about where people were staying in Airbnb properties, to create a map.
Unrelated Public Data Can Inspire a Story of Your Own
In the US, a government statistic revealed that more than 4,000 students drop out of school every day. Those children go on to have a 40% higher unemployment rate, a 70% higher rate of government assistance and are more than eight times as likely to end up in jail.
Whirlpool discovered that one of the common reasons for children skipping school was because their families were too poor to clean their clothes.
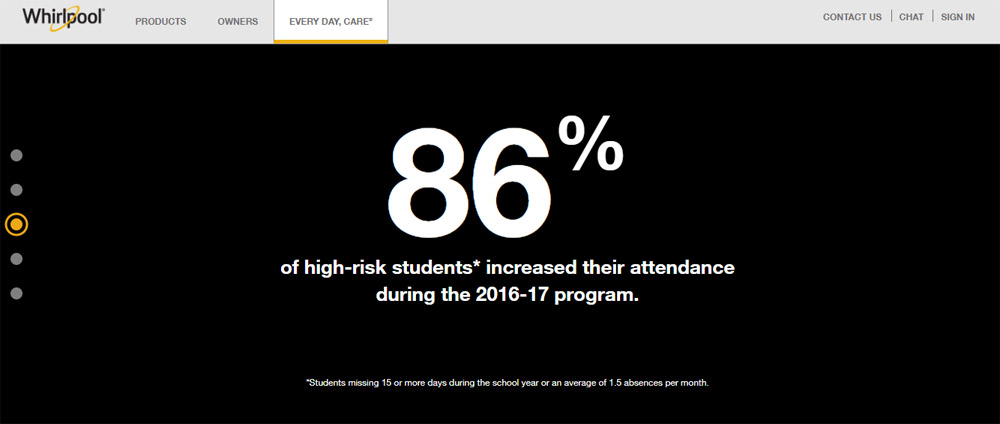
This data led Whirlpool to launch a programme to put washers and dryers in schools so that the kids could have their laundry taken care of.
According to this report, “in the first year, the programme saw 2,300 loads of laundry washed. More than 90% of tracked students increased their school attendance compared to the previous year, with some students attending the equivalent of almost two weeks longer. Teachers also saw increased class participation in 89% of the tracked students.”
Whirlpool created a specific campaign site to collate videos, stories and data.
Data Sourcing is the Key to Getting Started
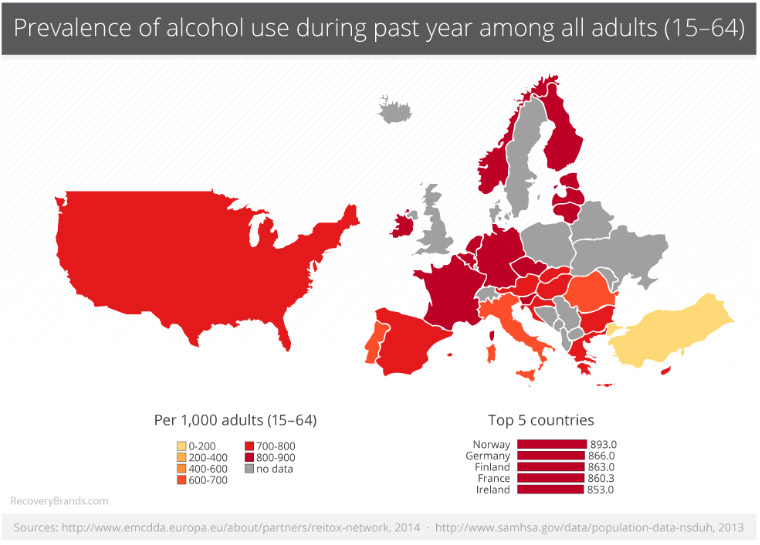
Addiction treatment specialist Recovery Brands compiled a wealth of data about drug and alcohol use across the globe and it created a series of maps, showing the volume of substance use in the USA and Europe.
The maps speak for themselves, and you can examine them all here.
How to Begin a Data Storytelling Strategy
Let’s sum up the process here, and look at practical steps for producing a storytelling campaign that uses data visualisation.
- Find a story that resonates with your target audience. One where the customer can be the hero and your product can be a character.
- Remember the structure. Good storytelling needs a beginning, middle and end, and it needs a hero, a theme and a purpose.
- Gather data. This is likely to be the largest task. You might spend weeks collating data from multiple sources, or carrying out market research. Good, credible data makes a real difference when you come to write your story.
- Find the story in the data. The story might present itself in a surprising way, or you may create a story from unrelated market data that relates to your target audience. The story might be the data itself – allowing the reader to explore the data for their own amusement.
- Decide on your design. How will you present the data? A series of static charts? An infographic? An interactive data visualisation?
- Think about promotion. Factoids, memes, tweetable charts or graphics that can be shared on other social channels can help you get your story out there. Atomise your story into different parts, so you can publish it in multiple places (as well as encouraging other publications to republish it).
Embracing the Future of Marketing Through Data Storytelling
As we delve deeper into the digital age, data storytelling emerges as a vital tool in the marketer’s arsenal.
It’s not just about presenting facts and figures; it’s about weaving these elements into compelling narratives that resonate deeply with audiences.
The ability to tell a story through data not only sets brands apart but also creates a more engaging, informative, and memorable experience for the audience.
As this article demonstrates, whether it’s through customer data, personal stories, or public statistics, every piece of data holds the potential to tell a captivating story.
The Journey Ahead for Marketers and Storytellers
Looking ahead, the fusion of data and storytelling in marketing is poised to become more sophisticated and integral.
It’s a journey of continuous learning and adaptation, where creativity meets analytics. For marketers and storytellers ready to embrace this evolution, the opportunities are boundless.
By harnessing the power of data storytelling, brands can not only inform and engage but also inspire and transform their audience’s perception, making every story not just heard but felt and remembered.
Read More:

