Paid Media – whether it’s search, social, display, etc. – is a critical component of every B2B marketing plan. It ensures that your brand and your content is seen by a targeted audience and, compared to many other marketing channels, it’s scalable.
But as any paid media practitioner knows, getting the right people to click on your ads is no easy task, especially at a cost effective rate. Moreover, creating ads and getting clicks is one thing; effectively measuring it is a completely different beast.
Measuring your performance is critical because it allows you to prove the value of your work, as well as improve your performance going forward.
When management asks you why they are investing the amount of budget they are currently investing in paid media, you need to be able to point to data and show them how far their investment is going. When the going is good, pointing to the number of clicks and leads you’re driving may be enough — making the “more leads equals more revenue” logical jump is easier when revenue is climbing. But if and when things inevitably get rocky, those top-of-the-funnel metrics will likely not be enough to keep your paid media budget out of scrutiny.
You need to be able to prove your value in revenue terms — show your true return on investment.
Before we cover how to measure paid media ROI (or return on ad spend – ROAS), we’ll first discuss some other key paid media metrics.
Cost Per Lead (CPL)
The majority of paid media channels operate on a pay per click (PPC) or pay per thousand impressions (PPM) model. As such, they want you to think and optimize in those terms. How do you get the most clicks per dollar spent? This results in an easy to measure cost per click (CPC) calculation.
However, many marketers are more sophisticated than this and know that not all clicks are created equal. If they are being held to a lead goal, they want to know how much they are paying for leads, not clicks (CPL vs. CPC).
Through proper tagging (UTM parameters) or through ad network integrations, many B2B marketing analytics are able to track traffic from channels or campaigns and properly attribute lead generation. When you know how many leads a channel or specific campaign generated and you know how much you spent on that channel or campaign in the same time period, you’re able to calculate CPL.
CPL is a good high level indicator that your paid media is attracting the people that you’re actively targeting and that your offer is appealing.
Cost Per Opportunity (CPO)
Moving down the funnel, paid media marketers should also be measuring their cost per opportunity. This begins to take into account click and lead quality. If your paid media campaigns are generating clicks and leads, but they’re not getting through the marketing and sales qualified lead stages, they aren’t particularly valuable.
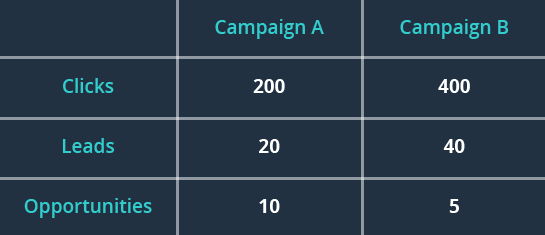
Let’s take a look at an example:
If you spent the same amount on each campaign, say $2,000, and you gauged campaign success based on CTR (what ad networks want you to use), you would think that Campaign B clearly outperformed Campaign A. If you took it a step further and judged the campaigns based on CPL, you would also think that Campaign B performed better ($50 CPL compared to $100 CPL).
Not until you take into account opportunities do you find that Campaign A was actually resonating with more qualified people. Even though it generated fewer clicks and fewer leads, it generated twice as many sales opportunities, and therefore, had half as high of a cost per opportunity ($200 CPO compared to $400 CPO).
Revenue Per Lead
Driving a bunch of small deals is good, but driving a bunch of large deals is better. Revenue per lead measures lead quality across two dimensions: deal size and win rate.
First, are your campaigns resonating with big targets or just the low hanging fruit? And second, are the leads that you are generating converting into customers?
As paid media channels mature and adapt their pricing structures, there are an increasing amount of paid media opportunities to pay per lead instead of click or impression. If you’re paying per lead, you need to ensure that those leads are high quality and good for your business. Measuring revenue per lead for those leads is a clear way to make sure that investment is worthwhile.
We will discuss how to do that in the next section when we cover how to measure ROI.
ROI / ROAS
Now, for marketing organizations that are truly aligned with their sales team and have a revenue commitment, it’s important to take the final step and measure ROI. How much revenue was generated by the amount invested?
ROI takes into account everything that a business cares about — the quantity and quality of demand generated.
How To Measure It
So, how do you measure this? Measuring and proving ROI is the top digital marketing challenge of 2016 according to DemandWave’s 2016 State of B2B Digital Marketing.
It starts with attribution — a system that integrates with both your paid media channels (e.g. AdWords, LinkedIn, Facebook) and your CRM, where revenue data is held.
It also requires clear and organized naming conventions and tagging within your ad networks to ensure high data quality. Is the traffic coming from LinkedIn properly being marked as LinkedIn in your attribution solution? Is your traffic coming from Campaign A being marked properly? This is necessary for ROI reporting at the most broad level down to the most granular levels: total paid media ROI, ROI by channel, ROI by campaign, ROI by ad, etc.
Once your ads are properly tagged, an attribution solution tracks visitors’ touchpoints from the first touch to closed-won customer and the revenue that is generated.
Of course, in B2B customer journeys, there are multiple touches across multiple channels. So if one touchpoint out of ten was a result of an AdWords ad, it would be inaccurate to give the AdWords ad all of the revenue credit. A multi-touch attribution model will take into account where in the journey each touchpoint occurred and divide the revenue credit accordingly.
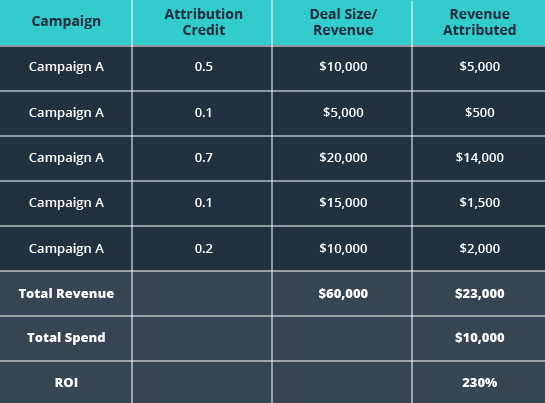
With the summation of all the partial revenue credit attributed to paid media, you can accurately calculate ROI. Here’s how that would work for calculating the ROI of a paid media campaign:
Even though Campaign A was involved in deals that totaled $60,000, through attribution, we are able to say that Campaign A was actually responsible for generating $23,000 worth of revenue.
If you spent $10,000 on this campaign, your ROI would be 230% or 2.3x.
With attribution, you can use the same method to calculate ROI for all campaigns across all channels (Total Paid Media ROI), the ROI for just one channel, or even the ROI for a single ad.
In attribution reporting, marketers can use the same process at the lead and opportunity stage. Multi-touch attribution also gives partial lead and opportunity credit.
For example, when reporting on front end, top-of-the-funnel metrics like leads, a Facebook campaign could be involved in the creation of 30 leads. For the sake of simplicity, let’s say that for each of the 30 leads, this Facebook campaign generated the first touch, but another channel generated each of the lead creation touches. In this scenario, the Facebook campaign would receive credit for 15 leads with a U-Shaped multi-touch attribution model (0.5 attribution credit x 30 leads). When calculating the CPL for that campaign, you would divide the cost of the campaign by 15.
Attribution models that give partial and weighted credit allow marketers to get a more accurate and nuanced picture of their impact. And it is a crucial component to creating reports, like ROI reports, that you and your boss can trust.


