Social Media ROI is an ambiguous, but extremely important metric. Digital marketers may feel overwhelmed when trying to figure out how to calculate or try to understand it. The return on social media efforts is a tough nut to crack, mostly because we don’t really know what tools to use.
As the Internet’s role in marketing grows, quantifying social media ROI is becoming an essential. As we discovered, social media runs on trust and sharing… and something that is not often discussed that wreaks havoc on analytics: dark social. The near infinite expanse of the web has allowed for sharing that can’t be tracked directly, making it difficult for marketers to understand how effective their initiatives are.
Behold: The Dark Side
What is dark social? All the social sharing that occurs after the first level of interaction.

The first interactions, like when the new Star Wars trailer on YouTube is shared on Facebook, is often tracked. From there, however, any other sharing that occurs through other channels is typically not tracked. For example, I shared the new Star Wars trailer to my brother over SMS, not on Facebook.
Studies point out that dark social represents individuals who have a 2x higher conversion rate. This is a key segment of the web that could help drive traffic and lead to conversions for your content, product or service.
Chances are you use Google Analytics to track your website’s analytics. With little tinkering, you will be able to get a better picture of dark social traffic that leads to your website.
Before We Begin
Many people fall into a trap with social media analysis: they are not clear about their intentions. Just like a sailor, you will need a compass, a direction and understanding of the water you’re sailing. What’s your research question? What do you want to find out about your dark social media traffic, and how do you want to use that information?
Let’s get started.
Step 1: Custom Segments for Dark Social in Google Analytics
Google Analytics is a powerful platform, but it relies on the user to configure everything to capture the right kind of raw data for analysis. Dark social is often left out. One of the best features of Google Analytics is that you can segment data into groups. For our case, we can split up the groups into two: first level social media traffic and dark social users.
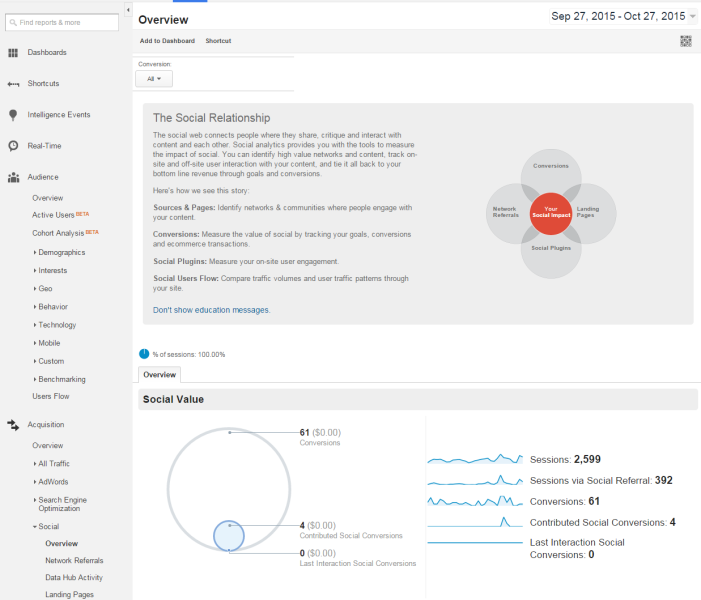
Google automates how users are sorted for first level social media traffic. We can see this with the Acquisition and Social menu items.
Data analysis works best when your data is properly organized, which is the biggest challenge here. How do we organize the data such that we can see two types of user traffic: the first interactions, and invisible interactions afterwards?
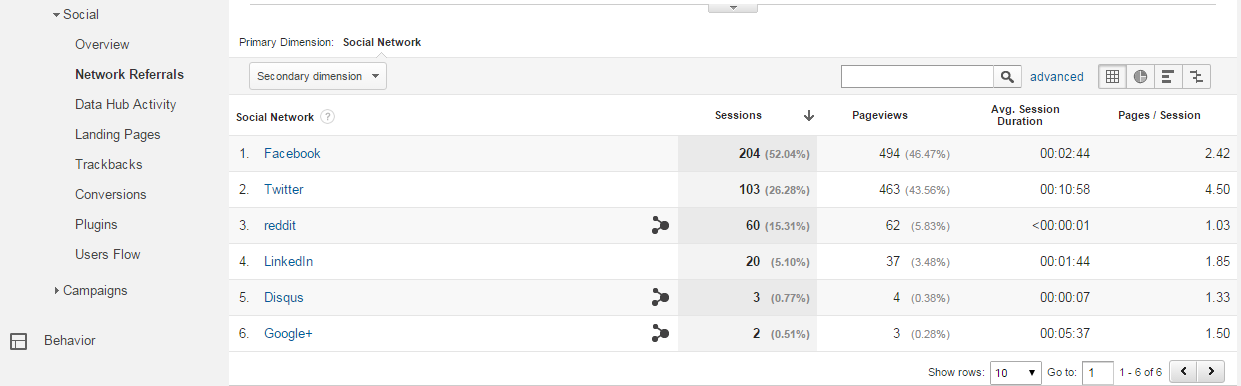
We discovered that Google Analytics can be set up with custom segments for each type of social network. Let’s get started. Log into Google Analytics. Next head to Acquisition > Social > Network Referrals.
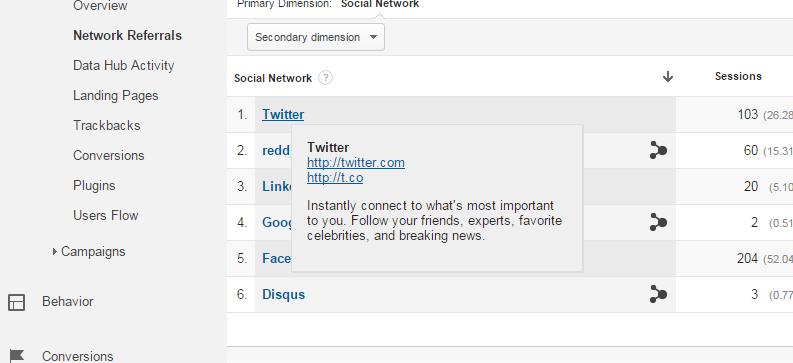
- Hover your mouse any of the social networks in the report. The information displayed will show you how Google determines the traffic from that network.
- Head over to “All Sessions” at the top. Click on the header. You will see new box that opens. Select “New Segment.”
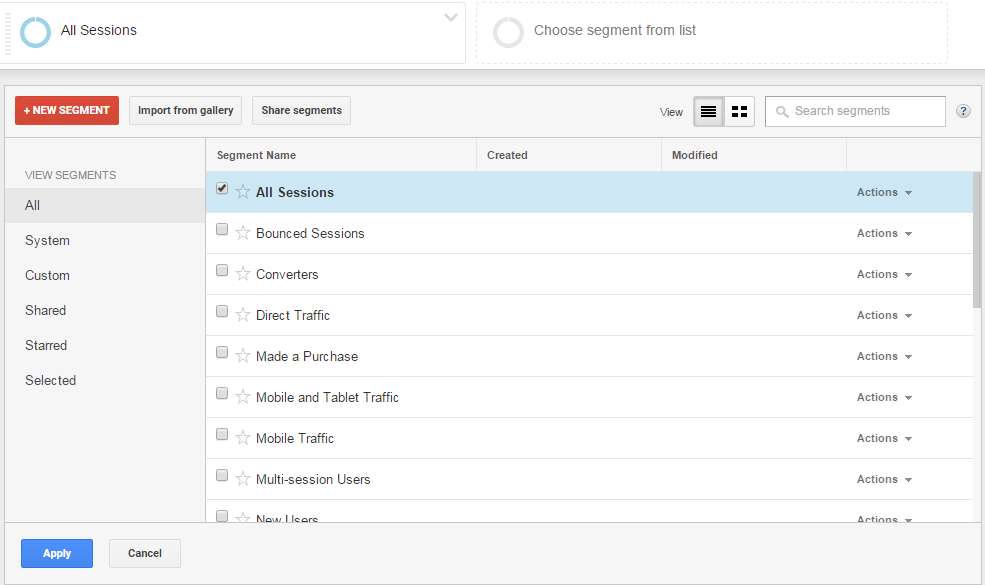
- Name this segment “Social Media Users.” These will be the users who arrived at your website through conventional and trackable first level social channels. For instance, if you share a link on your Twitter page, you are able to track that through Twitter.
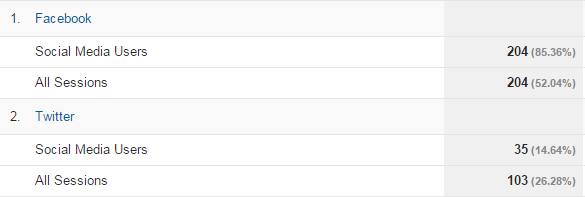
- Next, select “Source / Medium Contains” from the drop down. Add all the social networks you normally use in your social media channels with the type of medium, social, organic, email, referral etc. You can select them from the drop down or just type in Twitter. Take note of what shows up and add those too. Review the All Sessions numbers to see if they match the traffic. If they don’t, congratulations: you’ve found dark social, or previously invisible sources of social traffic.
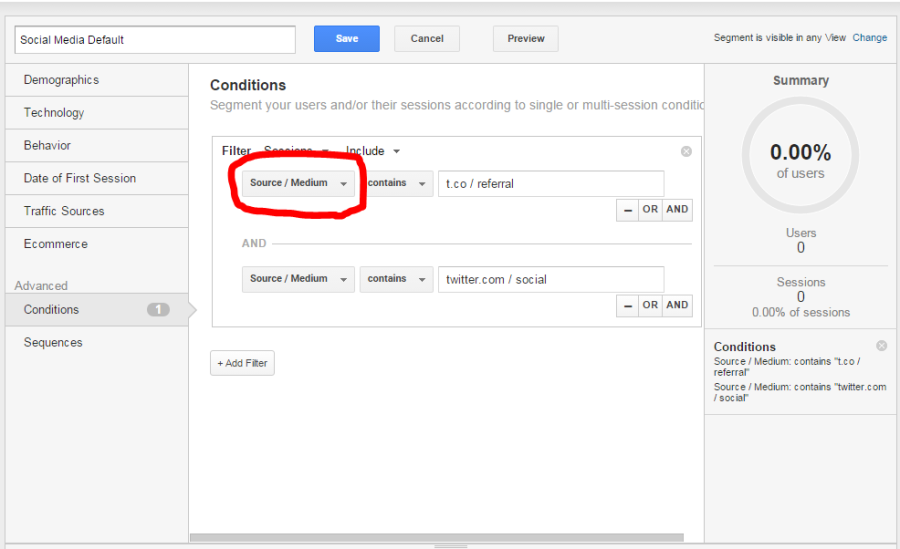
- Click on the arrow next to the segment at the top of the page and select “Edit.” Repeat this process for each social network until all the numbers match. The goal is to try to add as many of the channels as possible to account for the additional traffic you get. This will help show you the dark social that you might be missing from other sources.
If you have a lot of traffic to sort, it might be best to use Regex (regular expressions, a feature in Google Analytics). This would allow you to include multiple sources in one field.
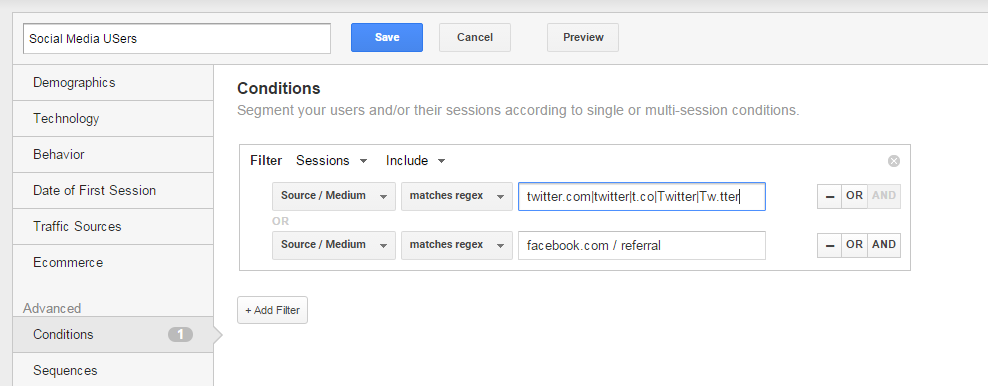
Go to Source then Matches Regex, then add each criterion with no spaces as it tells the platform to signify “OR”.
Don’t forget, you can set up Regex to include more criteria. To do this, Select Source > Matches Regex and take a look at the image above to see how we set it using Google’s recommendations. To know what the pipe is, hold shift and the backlash key to find out.
Learn more about Regex here: https://support.google.com/analytics/answer/1034324?hl=en
Step 2: Dividing Normal and Dark Social Traffic
So far, you were able to tease apart different sources to account for where does traffic come from. For the next step, we will need to divide the users into two groups, first level users (trackable) and dark social media clickers. First thing you need to do is open up a new Excel or Google Sheets file. Keep it handy until later.
As a reminder, let’s tease out the differences between the two groups. First level users are individuals who are lured to your site through social media and are automatically tracked through Google Analytics. In contrast, dark social media clickers are individuals who managed to find their way to the website through social media links that are not tracked, mainly by links you share and then distribute across multiple levels. It could even be other users who share the links that they create. These are not tracked and are missing data points for social media ROI.
Using URL Builder
You will need to separate the two groups from one another. The best way to go about this is to create traceable links that are shared through your social channels. These are able to get traced even if people share them outside social media.
If this is your first time setting URLs up in Google Analytics, you need to be aware that spacing and capitalization matter.
You need to be consistent the entire time because it affects SEO optimization. For example, if you say M Health, mHealth or mhealth… they will functionally be different, i.e. different data sets in Google Analytics. So keep things consistent. Here is a handy tip. If you are the sole manager or involved in a team, create a master list in an Excel or Google Sheets file with all the URL titles you plan to use.
Now that we got the nitty gritty out of the way, let’s move forward with URLs.
Head to the URL builder in Google and type in the URL you want to share. This could be a blog post or an about page on the company website; any page you want to track the dark social traffic for is fine.
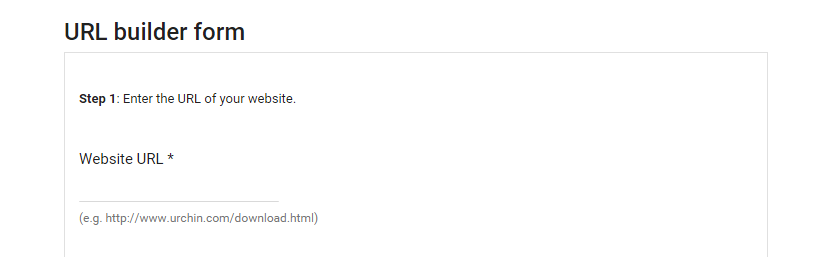
In the URL builder, you will need to add metadata to the link. This will allow Google Analytics to pick up the differences between the data sets. For the metadata, you can type anything you want that would allow you discern easily the types of data. Again, don’t forget about spacing and capitalization. Keep things consistent!
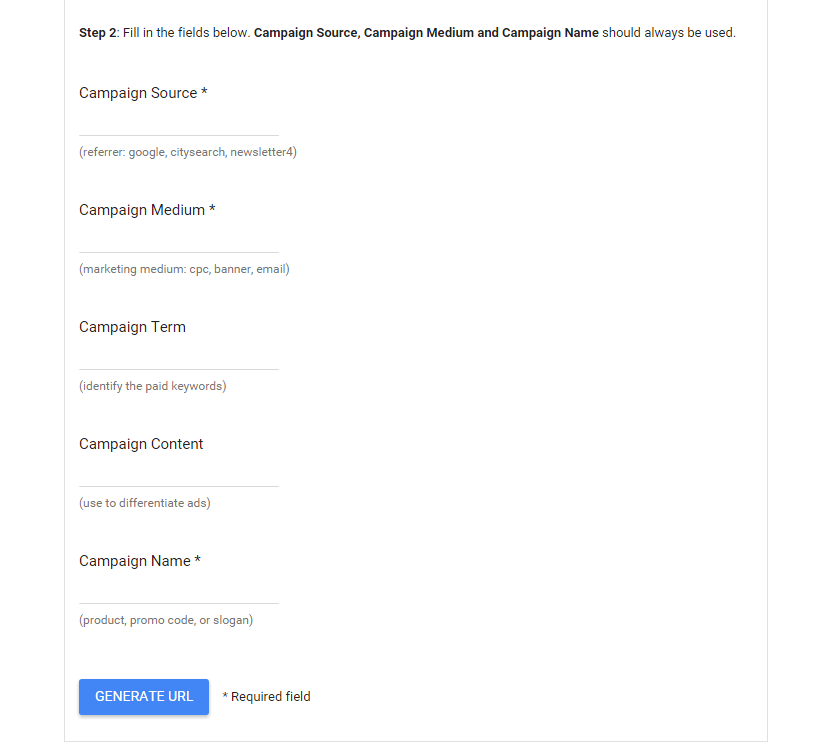
For example, you can call it “dark social clicks”. Finally, you will need to add the content type and the content title. This is of course up to you. The URL builder will pop out a URL that you can use throughout the sites. You may also want this to the segments we talked about earlier.
Step 3: Analysis
If the earlier steps were like trying to assemble your crew and sail to the islands, this part is like trying to find the treasure with a map.
Once you’ve captured your dark social data, we don’t recommend using Google Analytics as the primary platform for analysis. Instead, try transferring the data to Excel by copying and pasting or exporting the data to a new Excel or sheets file. Navigate to the reports that hold the metrics you want to analyze, then copy and paste the metrics into an Excel spreadsheet or use the Export function to create a file with raw data that you can open in Excel.
Use your creativity and company context to set up your data for analysis. There is no one size fits all approach here since every company is different. The goal here is to figure out what works for you.
Calculate the percent changes from one group to the other to see where the outliers are and highlight the insights you find in the data.
Continue to ask questions about your analysis and keep a record of your questions, thoughts, findings and improvements for the future. From our experience, this is sometimes more helpful in the long run as you collect more data and try to navigate through your findings.
Keep in mind that social media influences the user experience towards your site, specifically in terms of acquisition, fan creation, buzz, advocacy, engagement and even negative feedback. Not all these metrics are quantifiable so even making qualitative notes about them will help a lot.
Not all dark social calculations have to be complicated. Simple ones can also tell an exciting story. For instance, try calculating the percent changes from the groups to see what outliers are visible. From there you can dive in deeper with other analytical techniques and software like IBM SPSS.
Step 4: Let’s Recap
Before you even start anything, you need a clear direction with a question in mind.
First, set up Google Analytics to have custom segments that sort your data by each social network. When the traffic segmentation doesn’t match with your total traffic as calculated by Google Analytics, you know that other social channels are driving traffic. Figure out what they are by adding other social channels in. Your goal is to match the total traffic number with your segments. With this step, you can see the dark social media matter that was previously invisible to you.
Second, make sure to send out trackable URLs rather than regular URLs into the nexus of the social web in order to take account the dark social sharing that happens. Without trackable URLs, you won’t be able to properly take into account other traffic when studying your social media ROI. You will need to use the Google URL Builder to create trackable URLs.
Third, analyze and run more experiments. Be curious. Repeat.
We hope that this illuminates how dark social sharing can be tracked and monitored in order to help measure the return on investment of your social media strategy.
May the social be with you. Happy Analyzing!