Analytics is an area of constant refinement and shifting opinions. While numbers themselves are concrete, our interpretations, evaluations, and meanings of them can change. Definitions and context are key to understanding and interpreting data.
Why? Because every site we monitor needs a clear agreement on how things will be scored. Remember getting a report card in school? Each school used a set system and definition of success. Some schools considered an A to be a score from 90-100, while others set it at 92-100. That 2-point difference could really matter, depending on your goals (or strict parents).
The big questions for requirements gathering:
- How will we determine our A grade equivalent?
- What’s our definition of success?
- How can we get everyone to even speak the same language of success?
- What if this definition needs to change, or the needs of the organization have changed?
At Greenlane we have a process of identifying metrics in order to standardize definitions, and then see the data through output. Does your organization already know what you want to know and have it tracked in an agreed-upon method? Excellent! Proceed to the top of the class (aka the part about validating data).
Otherwise, if your organization’s data is less than satisfactory, or if you think something may be broken but are not sure what, or if you’re thinking, “How can people on my team agree on the same goals and be held accountable?” we’re sharing our process just for you.
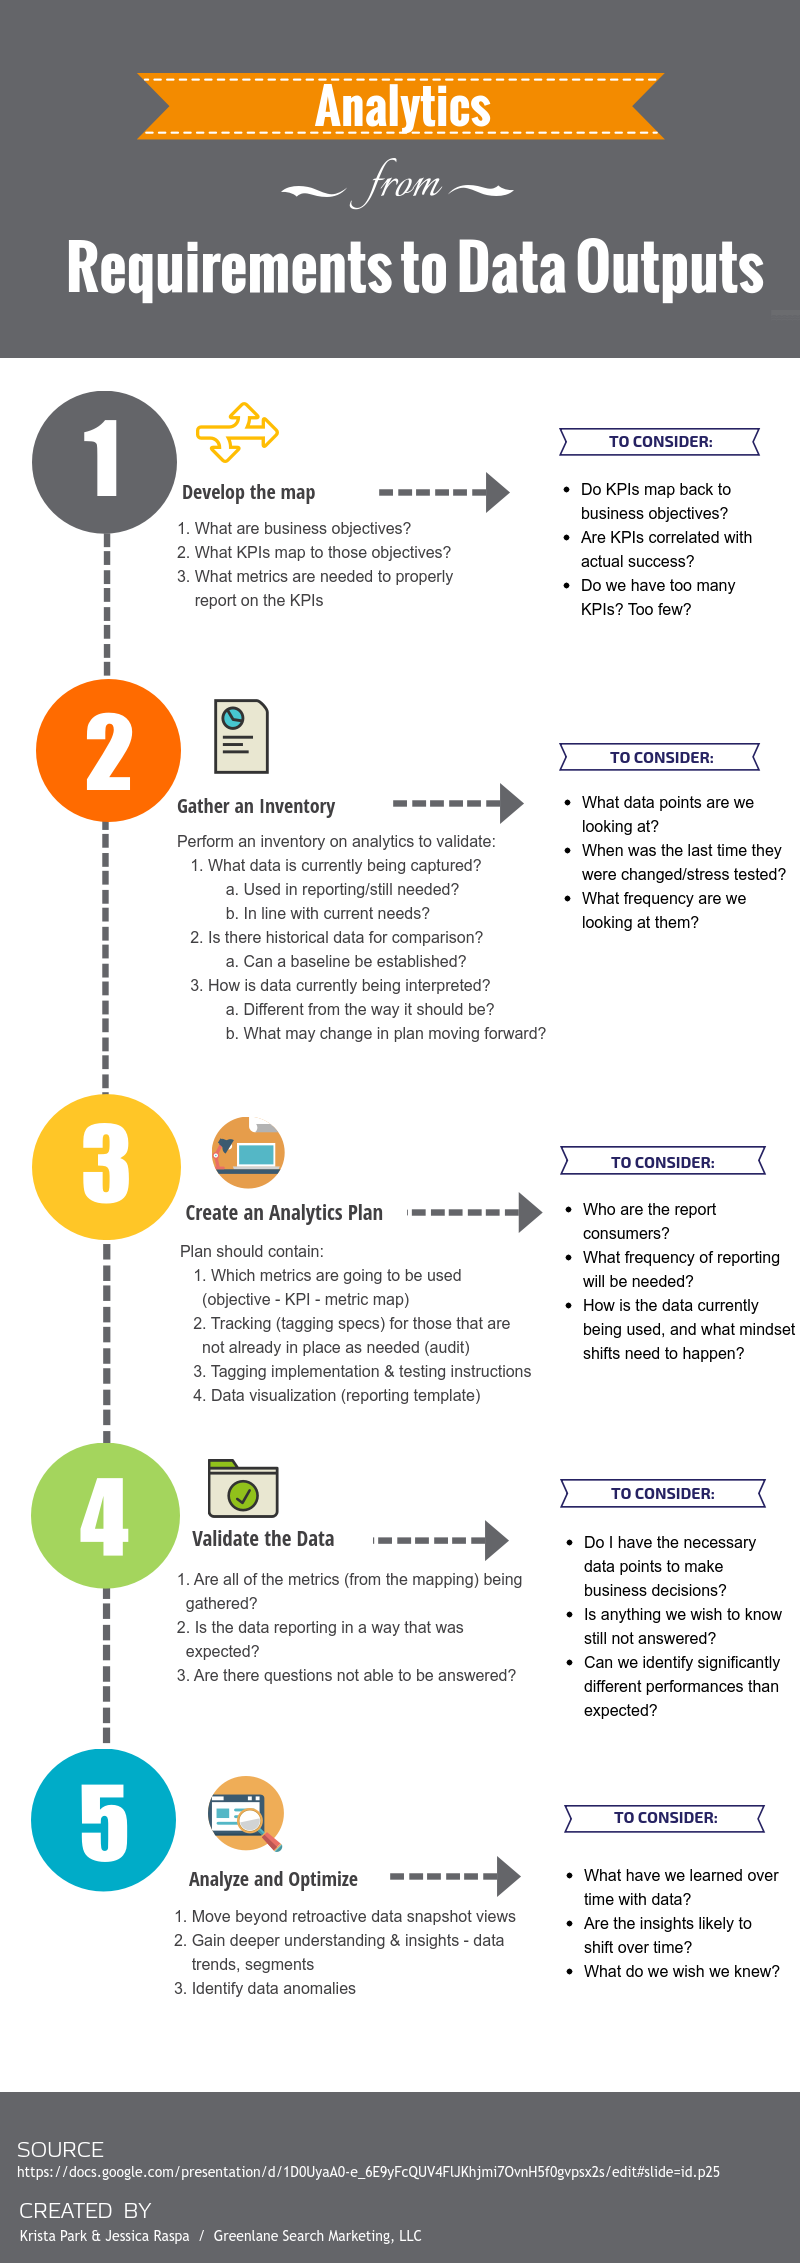
Hint: Are you a visual learner? Go to the bottom of the page for an infographic that outlines the following steps.
First decide what data is needed, and how it will potentially be used to establish the foundation of a measurement plan. This starts with looking inward. No, not to your soul, but to the needs of your organization.
What are the Business Objectives?
We try to keep these more general, as the intent here is to create performance ‘buckets’.
Examples of objectives:
- Reduce business expenses
- Increase customer satisfaction
- Achieve parity with competitors
What are the Key Performance Indicators (KPIs)?
While objectives are general, KPIs include more specific details such as % change, timing, and conditions. They’re goals infused with strategy and desired outcomes, that become the basis against which success is measured, business decisions made, and recommendations for optimizations are supported. Basically, they’re a really big deal.
Examples of KPIs:
- Decrease customer general inquiry call volume by 10% over the next 12 months.
- Increase usage of FAQ pages by 20% over the next 6 months.
Think about how these directly relate to the objectives above. By reducing call volume questions, through the expansion of content of the FAQ pages and directing consumers there, the call center will be free’d up to answer more sales inquiries versus general inquiries.
What metrics are then needed?
The metrics selected here are meant to support and create the basics of the KPIs. For our KPI examples, we would primarily focus on call volume and page views. This is not to say that every other metric will then be ignored. This is to help identify the most necessary metrics – the ‘A’ grade metrics, if you will. Other metrics will give us context into what is happening (e.g. page views went down by 10%, was there a decrease in sessions as well?)
All of this helps us develop the map:
- Objective: Reduce business expenses
- KPIs: Decrease customer general inquiry call volume by 10% over the next 12 months and increase usage of FAQ pages by 20% over the next 6 months
- Key Metrics: call volume, pageviews
Now that we’ve identified what we need, we must take a look at what we currently have.
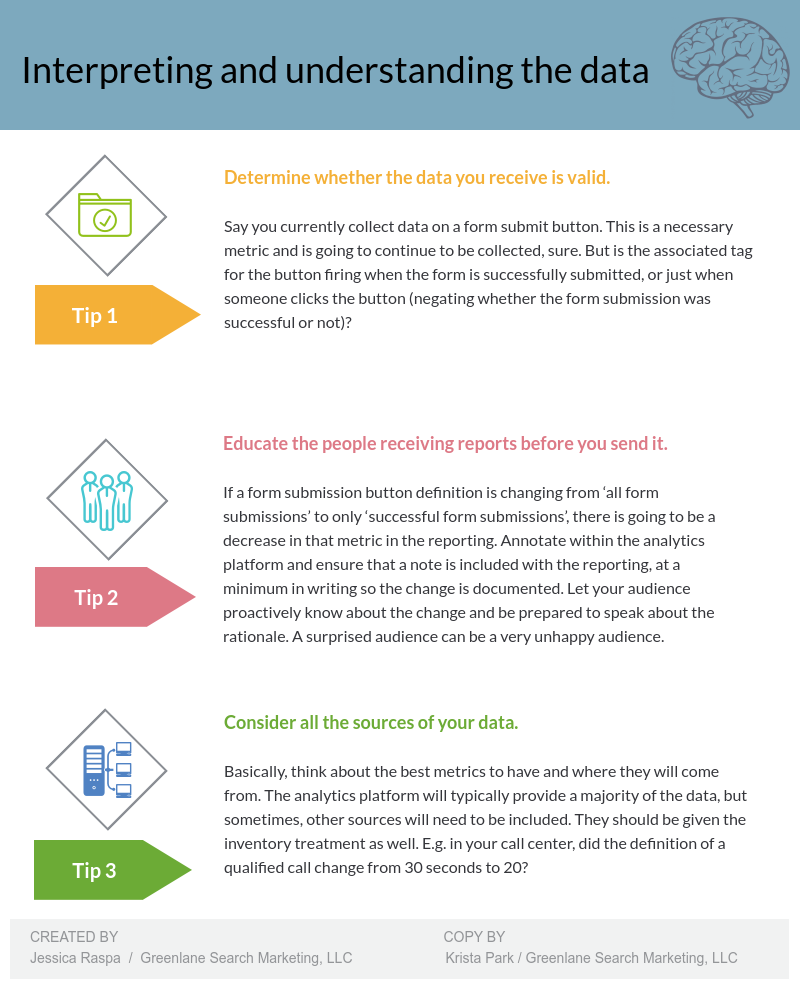
This is the housekeeping portion of analytics where we discover: what data do we currently collect, is it clean, and does it still work the same way?
Think of it in terms of a refrigerator:
- Do we currently have milk? (yes/no)
- Is it good? (non-chunky/chunky)
- Do I want to keep getting it the same way? (skim/whole).
This is the time to really be honest. Do we need to continue capturing clicks on that particular button that one person asked about three years ago? Does that button even still exist?
This portion of the process encompasses a few steps – it’s not enough to just know what we currently have versus what we want, but it’s about updating our understandings as well. You’re not going to check if you have milk, find out you don’t, and never buy it again (unless your entire diet changes).
So now we, hopefully, know what data we have, what we’re missing and what needs to change. On to the plan!
This is the culmination of the previous mapping and inventory audit. It’s the more technical side of the process, and considers details like:
- What tags are meant to fire where?
- What are the triggers?
- Can any part be automated?
These are the implementation details that an analyst, developer, marketer, etc. are going to need to ensure that all required and necessary metrics are being captured according to spec. I won’t dive in much farther than this since each analytics platform has its own specifications (and I don’t want to lead anyone astray).
This is usually the time that we start to develop the reporting template as well to help us solidify how data will best be collected and presented.
Now it’s time to QA your data collection (Remember that analytics plan? It also makes a great QA sheet!) But remember there are two sides to data collection:
- Are the tags and tracking performing as expected?
- Is there valid data being collected/presented?
Why validate both sides?
Consider a scenario in which you only check whether the tracking is performing. Tags could be firing exactly as indicated in the analytics plan. All triggering rules are perfect. You think everything is finished and step away from the tracking. Some time passes and now it is time to do the reporting. You log into your analytics platform, navigate to the data (or you’ve already automated the reporting process and are just looking at the output) and see — a bunch of crap. Some parts of it are identifiable, but you know that the nice, warm cup of data coffee you just got is going to be ice cold by the time you parse through this junk and clean it up.
What about the reverse? The data looks great, but what you don’t realize is that the trigger was misconfigured and is firing not just when the desired action is happening, but in another location as well. Could be a rogue button click. The tag has been created and rule put in place, but what if that particular button code had been copied and used elsewhere on the site as well?
Then it’s time to dig deep – into the data, that is. Looking at our example KPI, we then start to evaluate its performance.
- KPIs: Decrease customer general inquiry call volume by 10% over the next 12 months and increase usage of FAQ pages by 20% over the next 6 months
How many pageviews were accrued? From what channels? Of users viewing the FAQ page, our key page for this KPI, what page on the site did they come from? Evaluate what is happening, but also consider the context around why certain actions are happening.
Additional tracking
Now that data is being validated, do we have what we need to know, top to bottom? If I’ve added tracking to a link in the footer, say, a social button. I’ll know how many people clicked to go to Facebook. But what page were they on when they clicked?
If need be, update the analytics plan to reflect the necessary additions to the tracking. The addition of contextual data is sometimes necessary to truly understand what is happening on a site.
If you take one thing away from this, it should be to track with intent. We want to avoid the approach of “track everything just in case”. Please don’t be a data monkey. Not only can this cause site performance issues, but it can also cause analyst performance issues as well (as in headache inducing, too much granularity, holy crap what is this monstrosity of a data dump that once resembled a thoughtful, actionable report?).
Tracking with intent paves the way to reporting with intent. You should provide thoughtful analysis and actionable results. What is the data telling us about how the site is performing? How is it being perceived? What are the trends showing?
Into the Future
Ultimately, we want to use the retroactive data to identify the trends and segments. Identify anomalies. When needs change and the data collection is no longer presenting its ‘A’ game, whether it be a site and its functionality, or the data collection has become sloppy (or hopefully not both), then start again. Sometimes it’s back at the beginning, other times it’s just auditing and refreshing whats there.
So there it is. For quick reference, we’ve created an infographic listing the steps and key considerations for the process along the way. (It also has some nice colors and pictures to keep for reference.)


