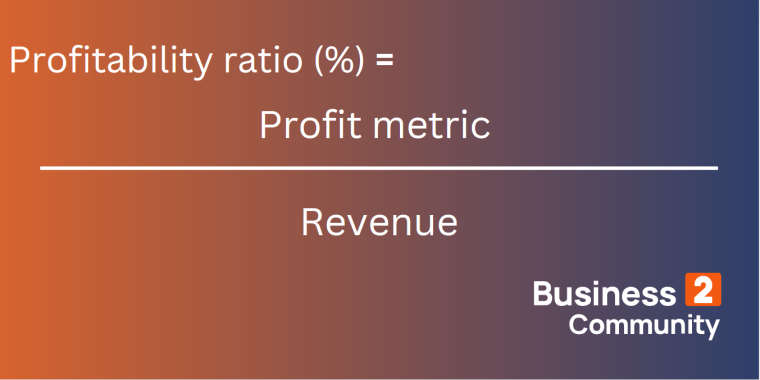
What Are Profitability Ratios?
Profitability ratios are financial metrics that evaluate a business’s financial health in terms of profit relative to other variables such as gross profit, assets, and equity during a given period.
In other words, the profit ratio indicates the portion of each dollar of sales above the cost of goods sold and how efficiently a business turns spending into profit.
Pro Tip: Utilizing a profitability ratio calculator can streamline this evaluation process for your business’s financial health. More on that later.
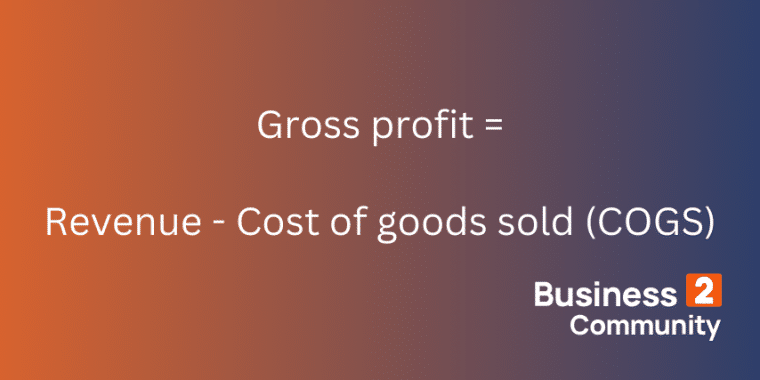
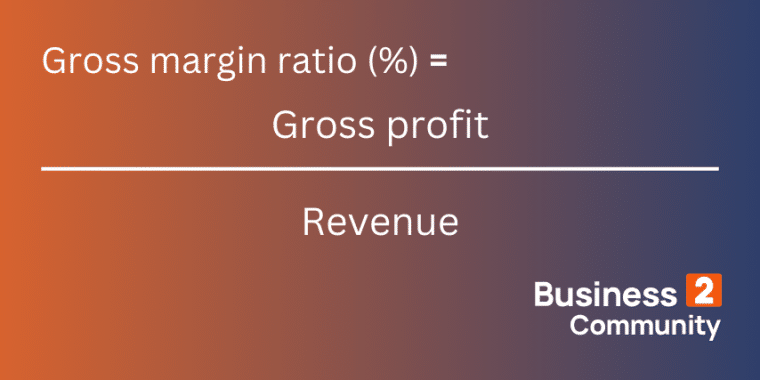
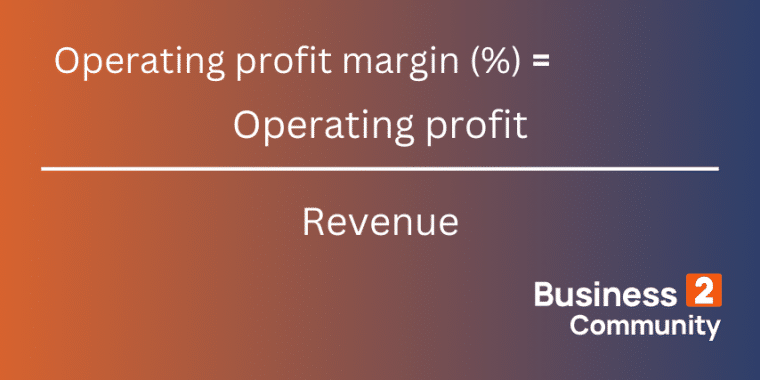
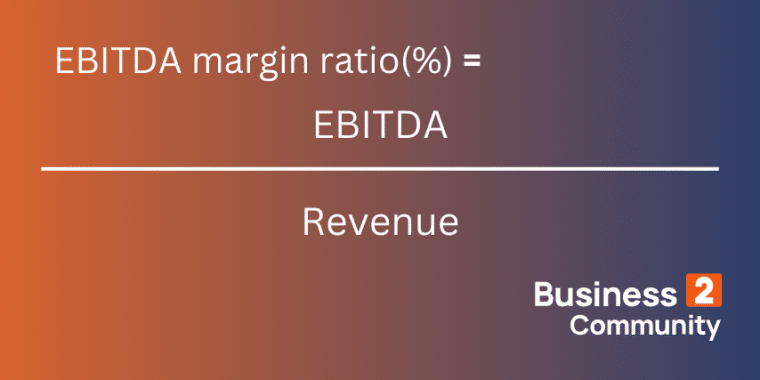
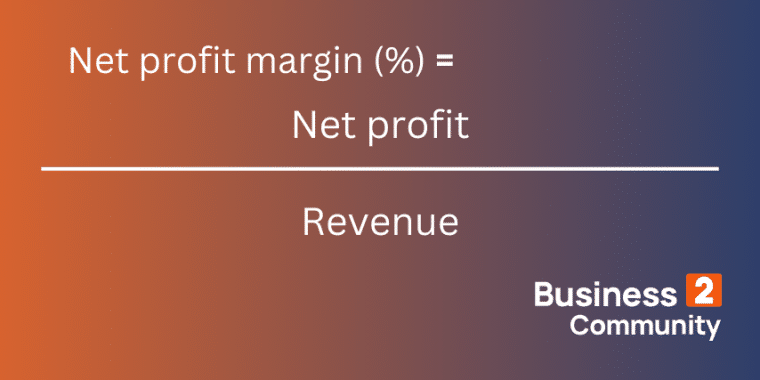
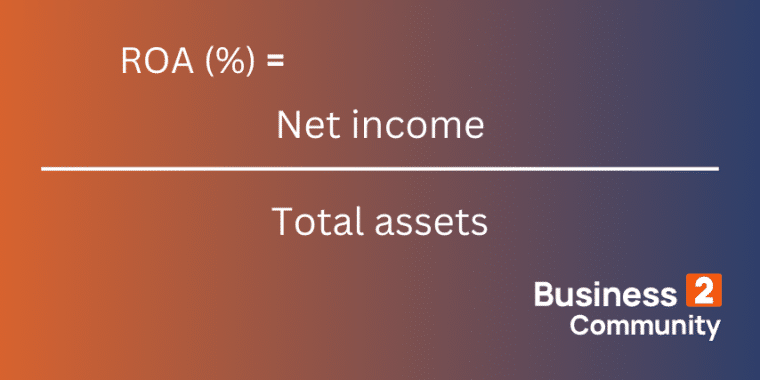
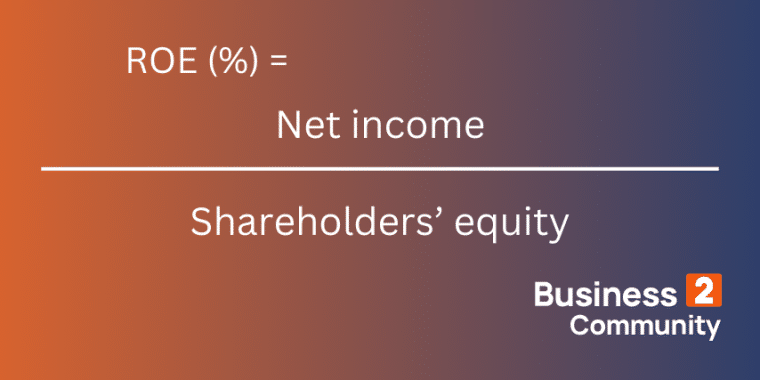
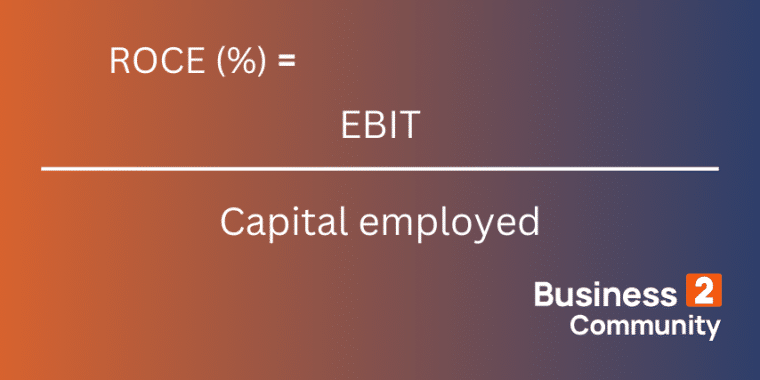
Key Takeaways: The Importance of Profitability Ratios Calculators Pro Tip: Compare profitability ratios to historical data, competitors, or industry benchmarks for meaningful assessment. Profitability ratios fall into two categories: margin ratios and return ratios. Margin ratios measure a company’s ability to turn sales into profit. These ratios compare revenue to metrics like: The formula for margin ratios is your chosen profit metric divided by revenue. Return ratios measure a company’s ability to generate returns for its shareholders. Common return ratios include: Higher profitability ratios are an indication of efficiency while low profitability ratios suggest a business: However, it is possible to generate big profits with low profit ratios and sometimes it is necessary to operate with poor profitability ratios in the short term in order to achieve efficiency in the long term. Always assess profitability ratios within context and alongside other financial metrics like revenue trends and leverage ratios. Here are five of the most common profitability ratios. Gross profit is the revenue left over after you subtract the cost of goods sold (COGS) i.e. the direct costs involved in producing the goods that a business sells. COGS can be found on a business’s income statement. The gross profit margin ratio compares gross profit to revenue. It tells you what percentage of revenue is left after direct operating costs have been covered. A high gross margin ratio means a business has runway to cover general expenses, like insurance and marketing, and still make a profit. It is a sign of efficiency. A low gross profit margin ratio, on the other hand, suggests a high cost of goods sold which means it will be difficult for the business to cover general expenses and still generate profit. This could indicate poor sales, strong competition, or disadvantageous purchasing arrangements. It is a warning sign that the business may not be sustainable in its current state. Operating profit, also known as EBIT or operating income, is the income generated by a business’s core operations before the deduction of interest and taxes. It appears on a company’s income statement. Unlike gross profit, which only accounts for the direct cost of producing goods, operating income accounts for all operating expenses e.g. rent, administrative expenses, and managerial salaries. Operating profit margin compares operating profit to revenue. It is the percentage of total revenue remaining after COGS and operating expenses have been paid. Because operating profit accounts for more costs than gross profit, operating profit margin should be a smaller figure than gross margin. A higher operating profit margin suggests a business: EBITDA stands for earnings before interest, taxes, depreciation, and amortization. This variable does not appear on a company’s financial statements but can be calculated using the formula: EBITDA = EBIT (i.e. operating profit) + depreciation and amortization (D&A) Like the gross profit and operating profit margins, the EBITDA margin measures a company’s profitability from operations. However, EBITDA margin is the preferred tool for comparing the operating performance of two or more companies. This is because depreciation varies depending on the value of a company’s fixed assets which can obscure a fair comparison. Net profit (also referred to as net income) is a business’s income after all expenses have been subtracted. This is the ‘bottom line’ on the income statement, the portion of sales that can be reinvested in the business or shared amongst the owners. The formula for net income is total revenue minus total expenses. The net income margin ratio is a more stringent measure of a company’s profitability because it measures the business’s ability to generate revenue while accounting for all expenses. However, it is not the best metric to use when comparing companies because it includes lots of potentially distracting variables. Businesses with high net profit margin ratios can make good profits at a smaller scale whereas a business with a low net profit margin ratio must generate sales on a large scale to earn big profits. Business operators can improve their net profit margin ratio by improving margins i.e. increasing prices or lowering operating costs. This may increase total revenue. However, you can also increase your revenue by bringing in new business and making more sales. This strategy will improve profitability but will not shift your net profit margin ratio. The right strategy depends on your unique business. Cash flow is the money that moves in and out of a business during a given period. It is calculated by subtracting total cash outflow from total cash inflow. Well-managed cash flow is essential to the survival of a business because you need cash in hand to: Consider the advantage of being able to access bulk purchase discounts or lower interest expenses because you can put up more money upfront. On the other hand, if your sales are poor and you have negative cash flow, you could struggle to pay debts and end up insolvent. Cash flow margin compares cash flow to revenue. It measures how much of a business’s sales revenue is converted into cash. The higher the cash flow margin, the more cash a business is generating relative to sales. This is a sign of good financial health. Return ratios tell us how well a company is using investment to generate wealth for its shareholders. Here are the formulae for three important profitability ratios in this category along with what they signal. Already know what you’re doing and just want to skip to our profitability ratio calculators? Just scroll down and get calculating. Return on assets is an indication of how effectively a company is using assets (e.g. machinery, intellectual property, or real estate) to generate income. It is calculated by dividing net income by total assets. ROA helps answer the question, “Was x asset a good investment and are we making the most of it?”. A low ratio suggests assets are under-performing. This metric is most useful for asset-intensive companies such as utility companies, streaming platforms, or car manufacturers. Shareholder equity is the value of the assets owned by shareholders after all liabilities are settled. It can be described as the total amount of ownership investment in a company. ROE expresses the relationship between income and equity. It measures how effectively a business uses equity to generate income. A high ROE will attract investors because it indicates a high return on investment while a low ROE signals inefficient use of shareholder capital and poor returns. Capital employed is the total amount of capital used by a business to generate profits. Capital can be used to pay for land, equipment, software, or other investments that translate into income. Capital employed is calculated by subtracting current liabilities from total assets. ROCE demonstrates the relationship between invested capital and EBIT. A high ROCE indicates that a business does a good job of generating profits from capital. This metric is best for comparing companies in capital-intensive industries such as the airline or mining industries. If you just want to get to calculating your profitability ratios and don’t want to work through all the math, you’re in luck. Just plug in your data into the fields in our profitability calculators below and hit calculate! JLR is a UK-based car manufacturer. We can find the following data in the company’s financial statements. Using this data we can make the following calculations. Both the operating margin and EBITDA margin have improved which suggests improved operating efficiency. Although the company’s net income was negative in both years (i.e. JLR made a loss), ROE and ROA made significant improvements. This signals that JLR made better use of its assets and equity. Cash flow margin took a dip which raises a red flag but it appears that JLR invested cash to improve their other profitability margins. This could be part of a long-term strategy to become profitable. Like any form of analysis there are right ways to calculate and evaluate profitability ratios and many more wrong ways. Here are a few important tips to keep in mind: Profitability ratios encompass various metrics, but some key ones include gross profit margin, operating profit margin, net profit margin, return on assets (ROA), return on equity (ROE), and return on capital employed (ROCE). These ratios provide insights into different aspects of a company’s profitability, such as its ability to generate profit from sales, manage expenses, and utilize its assets and equity effectively. Profitability ratios are crucial because they offer valuable insights into a company’s financial health and performance. By assessing how effectively a company generates profits relative to its revenue, assets, and equity, profitability ratios help stakeholders understand the company’s operational efficiency, management effectiveness, and overall profitability. They are essential for making informed decisions regarding investments, operations, and strategic planning. Business profitability is best measured through a combination of profitability ratios tailored to the specific needs and goals of the company. By analyzing various ratios such as: Businesses can gain a comprehensive understanding of their financial performance. Additionally, utilizing profitability ratio calculators can streamline the measurement process, providing accurate and efficient assessments of profitability. The golden rule of business is to bring in more money than you spend. But profit is not just about the bottom line. It’s also about realizing as much value as possible from your available assets. Understanding profitability ratios helps you identify inefficiencies, highlight red flags, and discover missed opportunities so you can grow your business and keep your investors happy.
What Are The Different Types of Profitability Ratios?
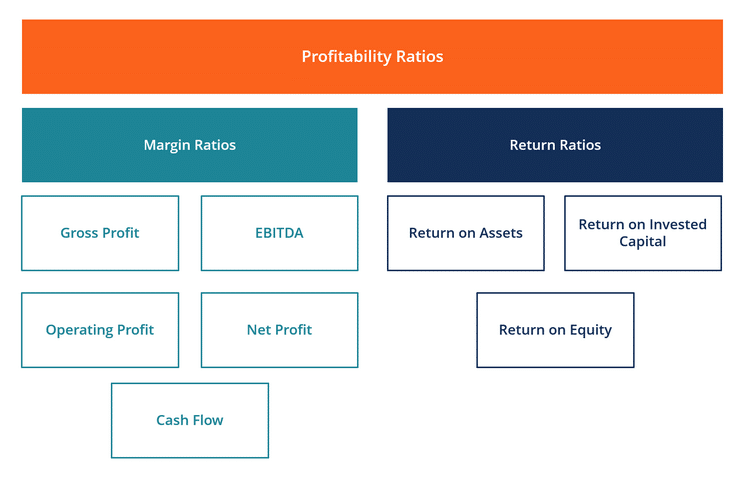
1. Margin Ratios
2. Return Ratios
What Is a Good Profitability Ratio?
How to Calculate Margin Ratios
1. Gross Profit Margin
2. Operating Profit Margin
3. EBITDA Margin
4. Net Profit Margin
5. Cash Flow Margin

How to Calculate Return Ratios: The Easy Way
1. Return on Assets (ROA)
3. Return on Equity (ROE)
3. Return on Capital Employed (ROCE)
Profitability Ratio Calculators
Return on Assets (ROA) Calculator
Return on Equity (ROE) Calculator
Profitability Ratio Calculation Examples
In million GBP
Year to 21 March 2023
Year to 21 March 2022
Revenue
22800
18320
EBIT/Operating Profit
544
66
EBITDA
2571
1896
Cash flow
3687
4223
Total assets
21709
21840
Shareholder equity
4239
4503
Net Income
-60
-822
Profitability ratio
Formula
2023
2022
Operating profit margin
Operating profit/Revenue
544/22800 = 2.38%
66/18320 = 0.36%
EBITDA margin
EBITDA/Revenue
2571/22800 = 11.27%
1896/18320 = 10.34%
Cash flow margin
Cash flow/Revenue
3687/22800 = 16.17%
4223/18320 = 23%
ROA
Net income/Total assets
60/21709 = -0.27%
-822/21840 = -3.76%
ROE
Net income/Shareholder’s equity
-60/4239 = -1.41%
-822/4503 = -18.25%
3 Important Tips for Evaluating Profitability Ratios
What Are the Most Crucial Profitability Ratios?
Why Are Profitability Ratios Important?
How Is Business Profitability Best Measured?
Raw Profit Isn’t Everything: Maximize Potential with Profitability Ratios

