When was the last time you felt so excited about a soap brand that you wanted to grab a bar of soap and dive right in? Have you ever linked soap to adventure? Cinthol did just that with their ‘Alive is Awesome’ campaign. The clever and vibrant ads, filmed in various beautiful spots with young people singing and enjoying baths, aimed to make Cinthol look like a fun and adventurous brand.
In this new report, Unmetric, the social media benchmarking company from New York, analyses the social media impact of this campaign and how well Cinthol fared compared to its competitors.
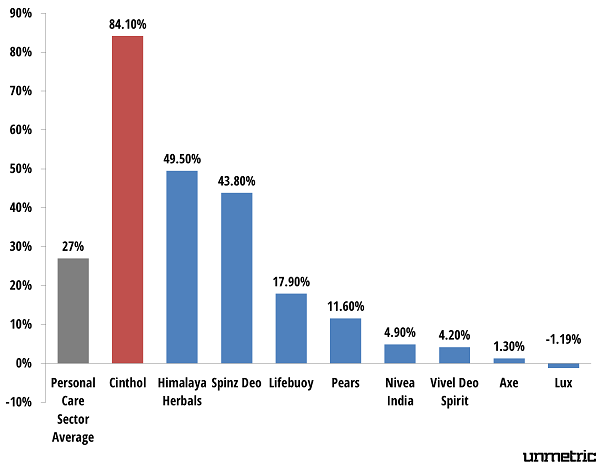
Cinthol effectively utilized their social media accounts to promote the campaign, particularly their Facebook page. Their fan base increased by an impressive 84.10% during the analyzed period, which is over three times the Personal Care sector average of 27%. They also experienced a significantly better growth rate compared to other top brands in the sector.
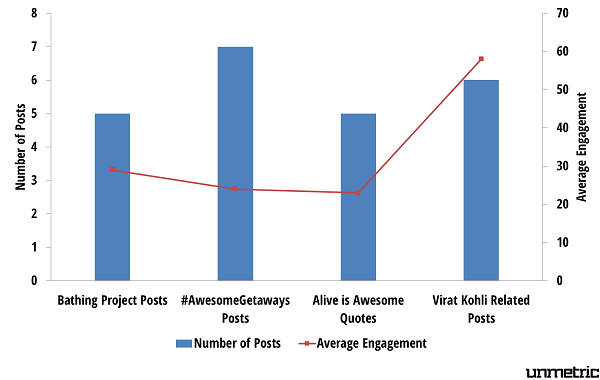
Cinthol had a well thought out content strategy on Facebook and most of their updates revolved around the ‘Alive is Awesome’ campaign by posting pictures and videos of the commercials. The posts also featured quotes from the likes of Joseph Campbell, Marty Robbins, Peter McWilliams, etc.
Cinthol mostly posted about Awesome Getaways, which featured amazing and adventurous destinations around the world. The Awesome tag is in line with its brand messaging and it’s interesting that a personal care brand will be borrowing from the travel sector by posting paradise beaches. However, in a sign that soap and travel doesn’t always mix, its fans engaged well with posts that related to the cricketer and brand ambassador, Virat Kohli, especially the contest which asked the fans to figure out what’s going on in Virat’s head. In India, cricket wins almost as much as the chick-and-click ads!
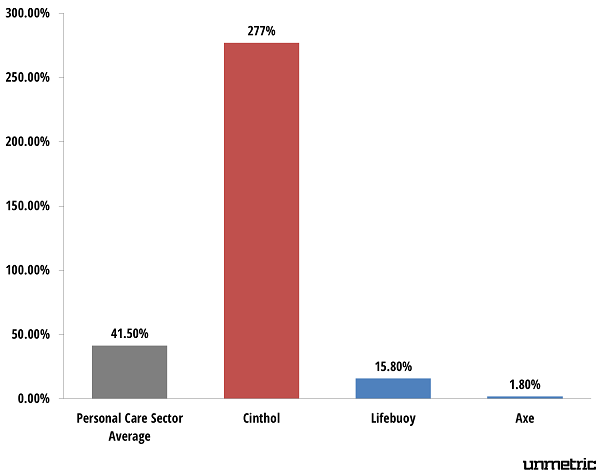
The ‘Alive is Awesome’ campaign also had an amazing impact on Cinthol’s Twitter account which saw a staggering 277% increase in follower growth, while the Personal Care sector average growth rate was 41.5%.
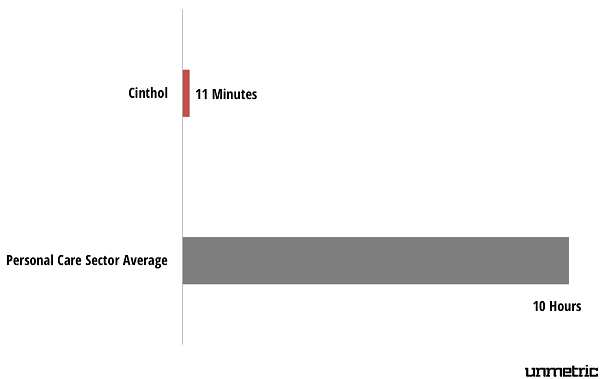
Cinthol also used Twitter extensively to reply to fans’ queries. It only takes 11 minutes, on average, to elicit a response from the Cinthol social media team, whereas the Personal Care sector average response time is 10 hours. Most of these replies came as a result of the #MakesMeAlive hashtag contest Cinthol was running to giveaway a Virat poster. Cinthol kept the momentum going by quickly responding to tweets and also retweeting lots of tweets, infact, 67% of Cinthol’s tweets were retweets.
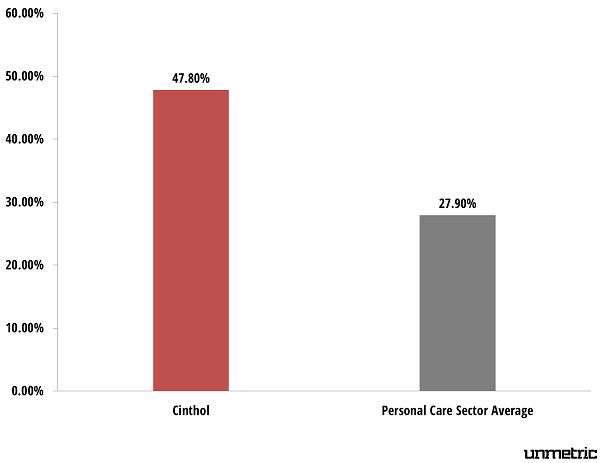
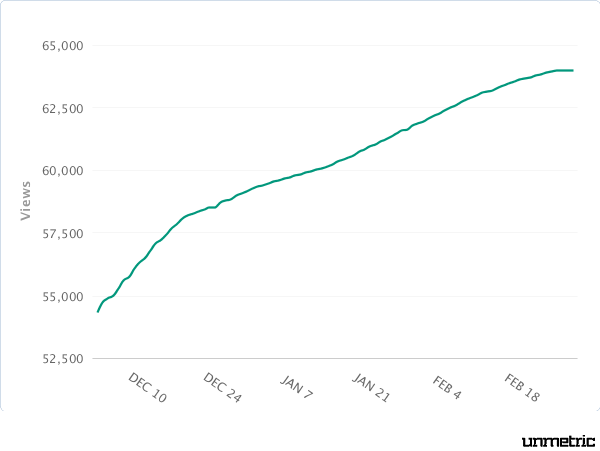
Cinthol’s YouTube channel also saw lots of activity, thanks to the amazing commercials that depict adventurous ways and places to use your Cinthol soap, the number of views on the YouTube channel grew by 48% during the time period analyzed.
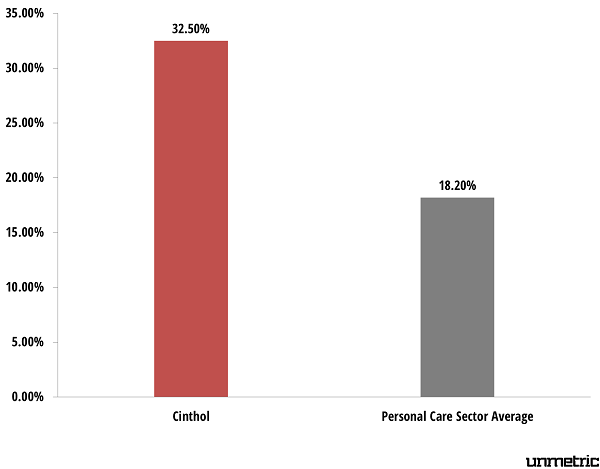
The number of subscribers to the Cinthol YouTube channel also grew by 32.5% during the same period which is twice the Personal Care sector average subscriber growth rate of 18.2%.
The most watched video on the Cinthol’s YouTube channel was the Hindi version of the ‘Alive is Awesome’ video with more than 65K views and growing. Apparently, watching someone taking a bath in scenic locations seems to be enjoyable for lot of people!
Cinthol seems to know the secret of engaging with its fans by taking a mundane product such as soap and make people see it in a new light that evokes thoughts of adventure and coolness. Also the ability to give out a unified message across social channels has really worked well for Cinthol.
Not all the Personal Care brands in India are engaging their fans using social media like the way Cinthol does since many of the leading brands like Lux, Vivel Deo Spirit, Pears did not have a Twitter and YouTube account so were not considered for the Twitter and YouTube analysis.
Methodology:
Unmetric compiled the report by sourcing data from its own social media benchmarking platform. Data and Insights on Cinthol’s activities on Facebook, Twitter and YouTube were analysed for the period between 1st December, 2012 and 28th February, 2013.
