This has given me a headache – there are a lot of spreadsheets coming up so brace yourself.
I set up a new clients account last week and was taking them through it when a question that they asked gave me an idea.
Just take a moment to check the QS of the keywords below:
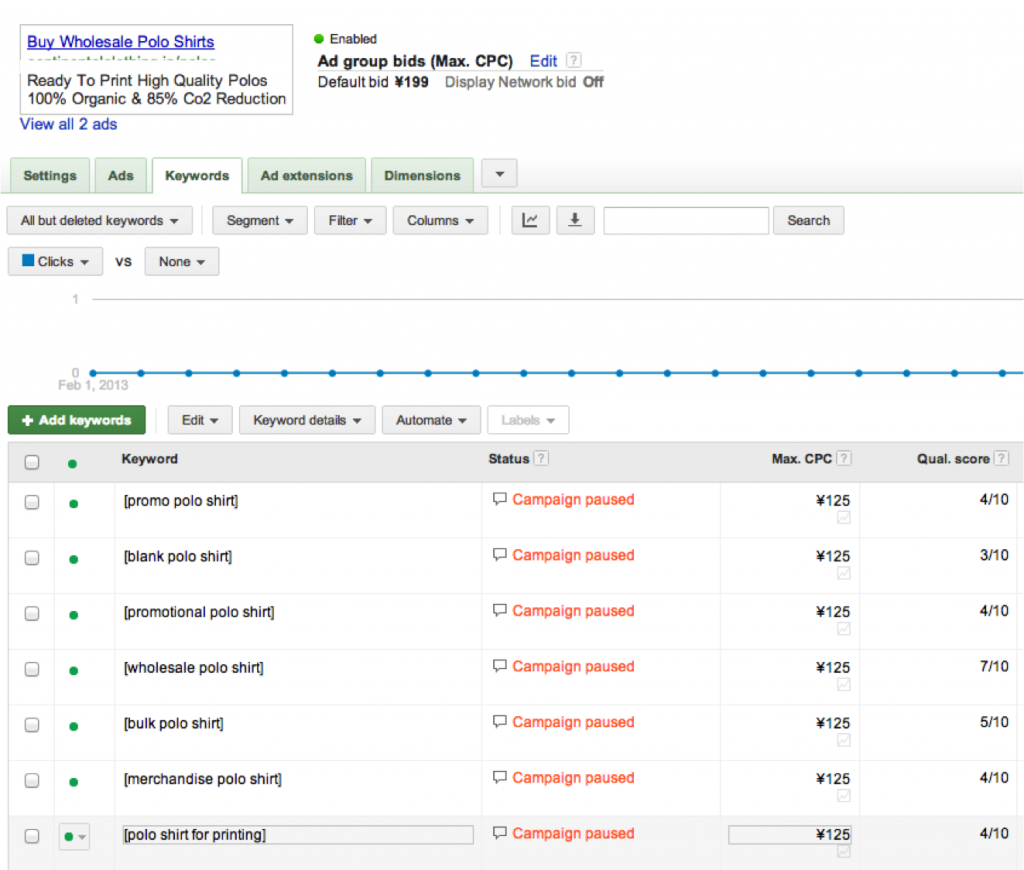
We were looking at this screenshot and they asked me why there was such a variance between the quality scores of these keywords in the same ad group. Bear in mind that the keywords have never run; they have been freshly loaded in so there is no performance history on them, they all share the same landing page and the same ads.
From experience I know that performance in terms of click through rate is a key determinant of quality score. I have no idea how important it is compared to other factors though, just a vague feeling that it is the most important factor based on past experience. I know that the accounts I manage with high click through rates benefit from high quality scores.
One thing that I noticed here was that the keyword with the highest quality score was “wholesale polo shirt” with a QS of 7. It was also the keyword that I used in the headline of the ad – in fact it is a proper phrase match.
I started to wonder if I was on to something and as this is a new account it was a great opportunity to try and reverse engineer Adwords quality score formula. In retrospect that is an undertaking that I am vastly under-qualified for but my analysis gave me some key insights that I will share with you here in the hope that others can take this further.
Let’s start with Google’s explanation of how they calculate quality score:
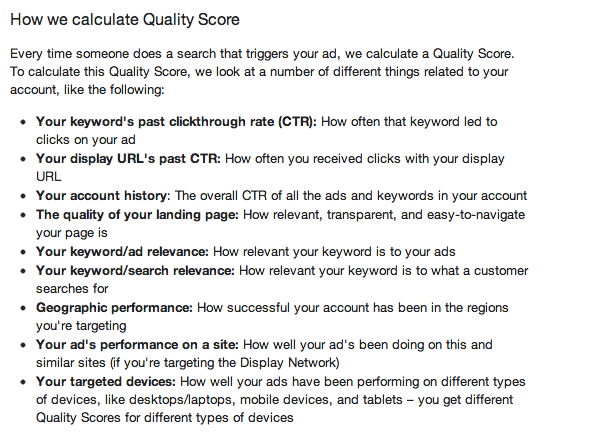
Now, considering that I am running this analysis on an account that has no history we can discount many of these in trying to understand the variances in quality score that my clients keywords had as shown above. Basically we can put it down to 2 things:
- The quality of your landing page
- Your keyword/ad relevance
There are a number of considerations here:
Quality of the landing page considerations
- how the keyword is used in the page heading
- how the keyword is used in the body text of the page
- image alt tags, video content
- page load speed, layout, HTML markup quality
There are a number of things that come into play; I didn’t go into this much detail as it would require a lot longer than I have available and also I am not convinced that I would get my hands on anything conclusive without doing the exercise on multiple accounts. Therefore I just considered the target keyword usage in the page text, URL and headings.
Keyword/Ad Relevance considerations
- Headline relevance to keyword
- Description Lines 1 and 2 relevance to keyword
- Display URL relevance to keyword
- Destination URL relevance to keyword
In fact for this experiment I discounted the relevance of description line 2 as the ads in this account contain a generic call to action in desc line 2 rather than anything related to the keywords in the ad group, but I looked at all of the other parts of the ad’s relevance to the keyword.
The background on this Adwords account
The client is a wholesaler of T-shirts, sweatshirts, bags etc that are to be used for printing. The account only contains keywords that define the website as a wholesaler and not a B2C retailer – otherwise we would obviously not be getting a great conversion rate. Each ad group focuses on a product type and then the keywords use that product name + a defining keyword e.g. “wholesale” or “blank”. There are 7 defining keywords used in the account:
- wholesale
- blank
- bulk
- for printing
- merchandise
- promo
- promotional
How we conducted the experiment
The account has 337 ad groups and 4653 keywords. All ad groups contain each of the 7 defining keywords. I downloaded all keywords into Excel and then downloaded all ads into Excel and used the vlookup function to match the ads to the keywords based on the ad group.
I then pulled out the key defining term for each of the keywords and the ads and also pulled out what type of product the keyword related to as this would then allow me to determine the landing page relevance to the keyword
I then ran a series of pivot tables to look at the average quality scores across the account based on different factors but largely based on the quality of the landing pages and the ad to keyword relevance.
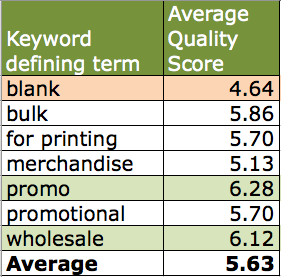 First up I looked at the average quality score by defining keyword to see if there were any patterns across the account. As you can see there is clearly a variance here with the words “promo” and “wholesale” getting significantly higher quality scores (6.28 and 6.12 respectively) than the term “blank” which had an average quality score across the account of 4.64.
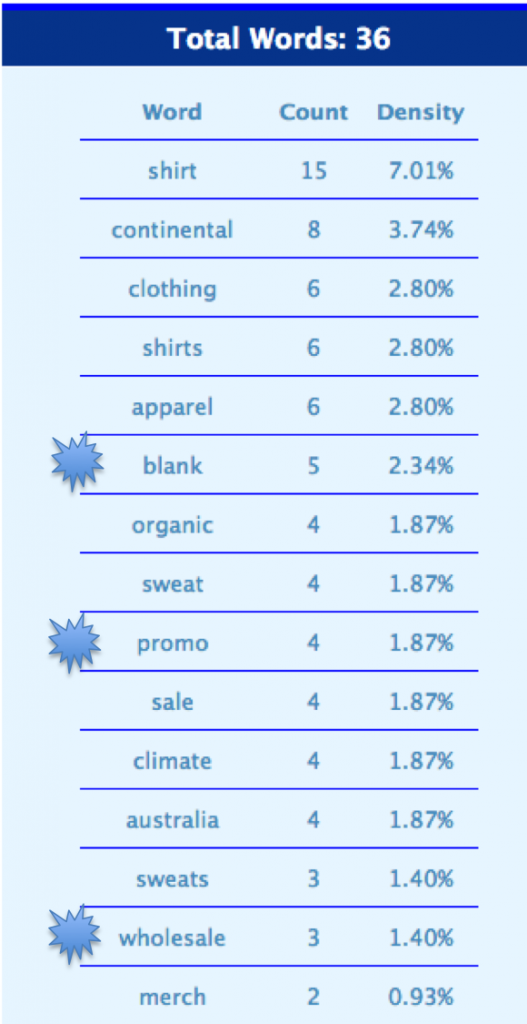
After seeing this the first question I had was on the websites relevance to these 2 terms – as a crude measurement, were they used more heavily in the content on the site than the term “blank”
It is not an ideal analysis of the website relevance but I checked the keyword density and it actually showed a negative correlation – the word “blank” was used more than the terms “promo” and “wholesale”.
Quality score by keyword match type
Google quality score is supposedly set on exact match keywords/terms and as we have both exact and broad variants of many of the same keywords in the account I thought that I would double check this:
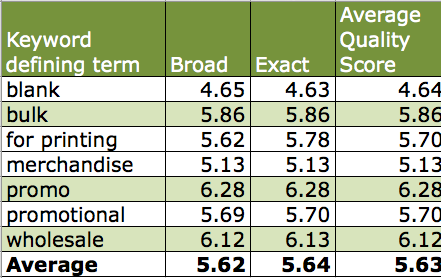
Looks close enough to me.
Quality score by looking at relationship between the keyword and the ad headline
First of all I looked at the relevance of the keywords defining term to the ad headlines defining term. Basically; what I wanted to see was whether or not, on average, did the keywords with the term “wholesale” in them for example, have a higher quality score when the corresponding ad also had the keyword “wholesale” in the headline of the ad.
Answer: No
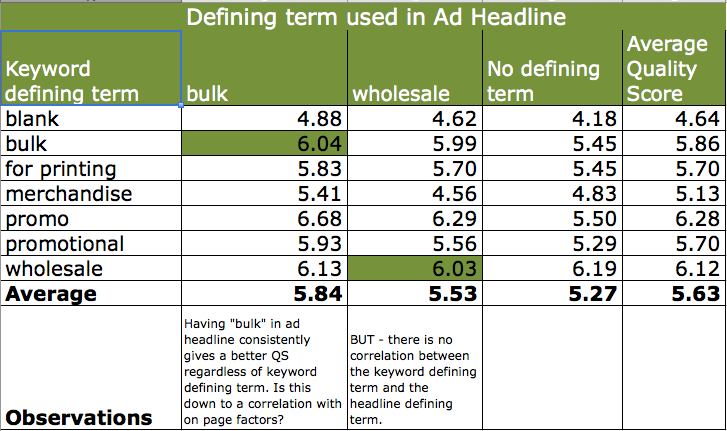
One interesting thing that I found here was that having the term “bulk” in the ad headline consistently gave a higher quality score across the whole account. This was interesting as “bulk” is not a term used at all in the website’s content so I have no ideas on why this may be? However – what I was hoping to prove didn’t come through – there was no link between the keywords text and the ad headlines text effect on quality score.
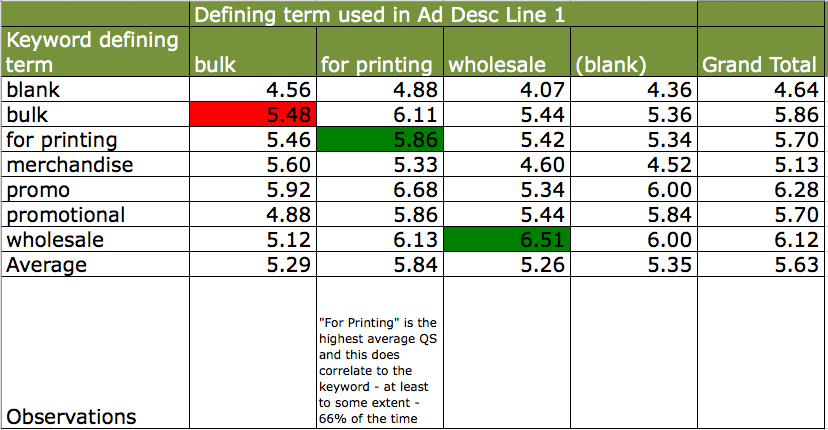
What about the ads description line 1?
There does seem to be some relationship here although the data is just not really enough to prove statistically that there is a connection or exactly how strong that connection is.
*You are comparing horizontally.
One takeaway is that perhaps having the users searched keyword in the description line 1 is more important than in the headline because the headline should be more about grabbing a users attention, so may not necessarily require the same keyword to signify relevance whereas the description lines 1 and 2 are more about qualifying relevance so require the keyword – see this infographic we created on how to write great ppc ads for more on this.
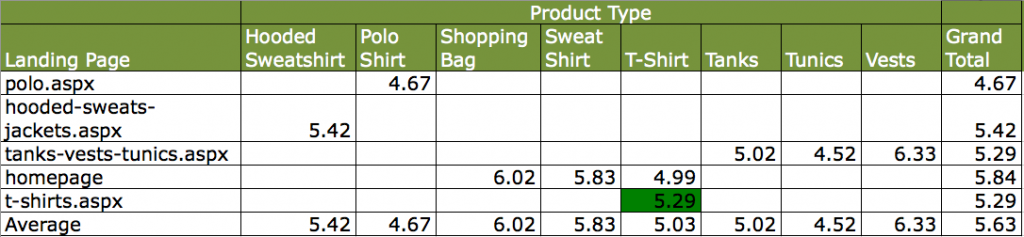
What about the display URL & Destination URL?
The interesting thing here is that the bags and the vests; the ones with the highest quality scores had the most tightly themed keywords and also the least keywords. This suggests that tight ad groups are important; but that’s nothing new really – PPC marketers have been suggesting that for years.
and the destination URL’s
There is something interesting here shown under the product types – basically for the same keywords we are using 2 landing pages – one for the broad and one for the exact ad group. One is specific to a group of T-Shirts and the other is the homepage which has all T-shirts on it. The landing page that relates in theme to the keywords has a higher quality score. This is something that we could easily test more comprehensively byt creating multiple ad groups and just switching the landing pages for the same keywords (DO NOT TURN THEM ON) to see the effect on QS. It’s only about a 6% improvement in QS but it is something at least. This is not conclusive enough to say that keyword relevance to landing page is 6% of the QS formula but it is at least a hint that it is important.
I plan to take this research further in the future as I think that the concept is good but I just lack the brain and the necessary time to properly reverse engineer the importance of these various factors towards the keyword quality score. I would love to hear about any experiments that others have been doing and your findings?