Last week, I shared a pair of lost customer survey and in-depth interview invitation templates. This week, I will provide a process to determine minimum sample size needs for your lost customer research project.
Why is it important to determine minimum sample size needs?
Resources are limited within all organizations, so being able to identify the minimum data necessary to make valid inferences about a population or a subset of a population is a necessity to being smart with your company’s resources.
What factors will sample size affect in your project plan?
Sample size requirements will affect the following factors in your lost customer project:
- Minimum response rate necessary for your automated lost customer survey
- Number of customers you need to interview for an in-depth lost customer research project
What is the process to determine minimum sample size for a lost customer research project?
There are several online calculators available to help you find the minimum sample size. However, these tools are usually made to estimate sample sizes for studies with little room for error and/or uncertain outcomes. As a result, these online tools are often too strict for accurate estimates and can result in inflated sample size requirements.
To get a more precise estimate of sample size for your study, you should use a more flexible sample size estimating formula. I recommend using the following formula, as it can be understood for those who are less quantitatively inclined:
Where:
- Population (N) = Total population of lost customers or subset of lost customers of interest
- Probability (P) = One minus the maximum expected probability of the most influential departure reason in decimal format (i.e. 0.5 for 50-50, 0.3 for 70-30, 0.15 for 85-15). If you do not know, then you must assume the maximum probability, which is 0.5. However, realize that the closer the probability is to 0.5, then the higher the sample size requirements will be.
- Standard error (SE) = The minimum accepted percentage error on either side of the resulting measurement divided by the number of confidence intervals ( Z). This is a percentage expressed as a decimal (i.e. 0.03 for 3% and 0.05 for 5%).
- Number of Confidence Intervals (Z) = The confidence interval constant. This input determines the confidence that a survey will produce the expected results within a given standard error. The standard confidence intervals used in statistics are 1.6449 for 90% confidence, 1.96 for 95% confidence, and 2.5758 for 99% confidence. For these types of studies 90% to 95% confidence are both acceptable.
The other factor that needs to be held constant is the time horizon covered.
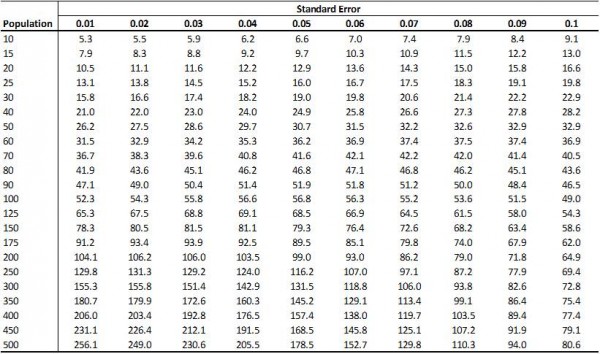
Below is a reference table for sample size estimates using a 95% Confidence Interval and maximum expected probability of 0.5:
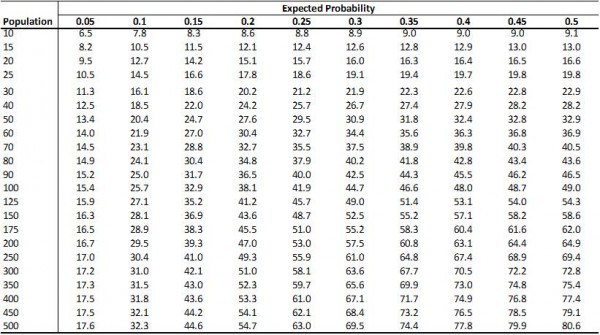
Similarly, here is a reference table for sample size estimates using a 95% Confidence Interval and a fixed percentage error of 20% (SE = 0.1):
This concludes my series on planning out and executing a lost customer research project. If you have not done so already, I recommend reading this series from start to finish prior to scoping-out a lost customer research project for your company, as it will answer many of the questions you will have.
Sign-up for our Free Weekly Newsletter to get the best new ideas for building technology companies.


