Welcome back to our series on marketing performance management. In this series we present a comprehensive guide for managing marketing via reporting end-to-end performance in terms of opportunities and revenue.
So far we’ve covered how to set up foundational reports needed to get the most relevant and accurate pulse on the revenue efforts of marketing. We’ve also outlined team reporting for managers running marketing programs and campaigns.
This chapter covers the paid media and search engine marketing channels. It provides a detailed view of the best reporting practices for marketers who care most about revenue and ROI.
Let’s get started.
Introduction To Paid Media Reporting For Marketing Performance Management
Demand generation marketers who spend on paid media often struggle to link their data to results further down the funnel. Since each ad network or social platform operates separately (the data can’t be shared across sources), paid media marketers typically can only produce basic lead conversion metrics and cost data.
Using an attribution solution that is integrated within Salesforce, paid media marketers can have clear visibility into the down-funnel effects of their work.
Account-based marketing requires a new type of tracking that most traditional, siloed channel platforms don’t accommodate. It’s critical to loop your channel performance data into your CRM and track touchpoints to their respective accounts and contacts. This requires a process known as “lead-to-account mapping” or “contact-to-account mapping.”
Most advanced attribution solutions are able to perform lead-to-account mapping, which assigns leads to their respective accounts, along with the touchpoints associated with those leads/contacts. This feature enables touchpoint data to be sorted by account and account grade, as well as by channel, campaign, keyword, etc. Lead-to-account mapping is the solution required to solve ABM reporting problems when it comes to paid media channels.
But, how do you take advantage of these advantages that attribution provides when you’re creating reports in salesforce to assess paid media performance?
Recipe 3.1 — Paid Media (AdWords) Revenue/Pipeline Report by Opportunities
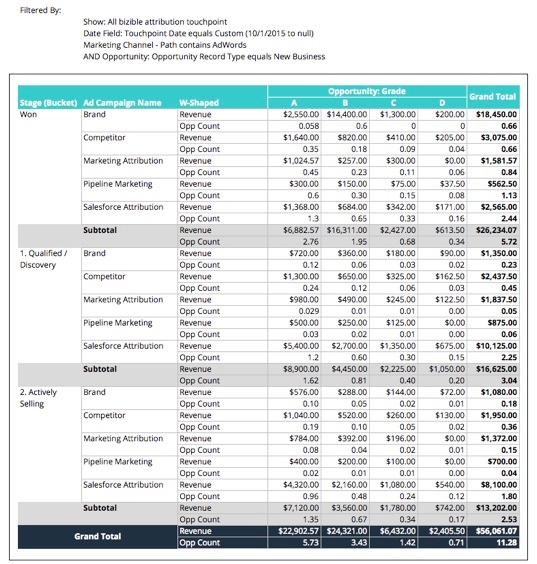
This report shows the AdWords channel impact on closed-won customers and open opportunities. This report uses a W-Shaped attribution model, which assigns 30% of the revenue credit to each stage conversion (first touch, lead creation, opportunity creation) and 10% of the credit to various touchpoints in between. This allows a marketer to see the effect of their channel’s impact all the way through to the opportunity stage.
Problem:
How do paid media marketers connect top-of-funnel paid media activities to down-funnel metrics?
Solution:
Create a channel & campaign/ad/keyword report using W-Shaped attribution.
This report in Salesforce shows the total influence of the AdWords channel on down-funnel opportunities. Whether the AdWords touches on these accounts were key stage transitions (receiving 30% of the credit) or middle touches (receiving < 10% of the credit), all opportunity-level impact from AdWords is represented.
Paid media managers can use this report to show, on a channel-by-channel basis, how well their marketing strategies are performing with respect to down-funnel metrics.
To create this report start with an opportunity report in matrix format. Set the Account Stage field as the row grouping and bucket it so that you have one bucket that includes closed-won opportunities (customers) and another bucket that includes all of your open opportunities (pipeline). Then, set the Ad Campaign Name field as the row subgrouping (alternatively, this could be Ad Name or Keyword) and Account Grade as the column grouping. To populate the table, drag Revenue into the middle of the matrix.
To filter campaigns from a single paid media source, such as AdWords, create a filter: Touchpoint Source equals AdWords. These parameters might look different for you, depending on how your company has set up their Salesforce Org and related tags and campaigns. Take a look at the report below.
Ingredients:
- Account Stage (Bucketed)
- Ad Campaign Name
- Sum of Revenue (W-Shaped or other attribution model)
- Sum of Opp Count (W-Shaped or other attribution model)
- Ad Campaign Name
- Account Grades
- Touchpoint Source or Marketing Channel equals [Paid Media Channel]
- Time Frame: Based on Touchpoint Create Date
(You’ll notice that the screenshot is also filtering by an ABM parameter of account grade, but that’s simply because we’ve moved our Salesforce Org to an ABM strategy, so the reports we create for paid media are filtered by account grade.)
Recipe 3.2 — Touchpoint Engagement by Subchannel & Grade (Account-Based Marketing)
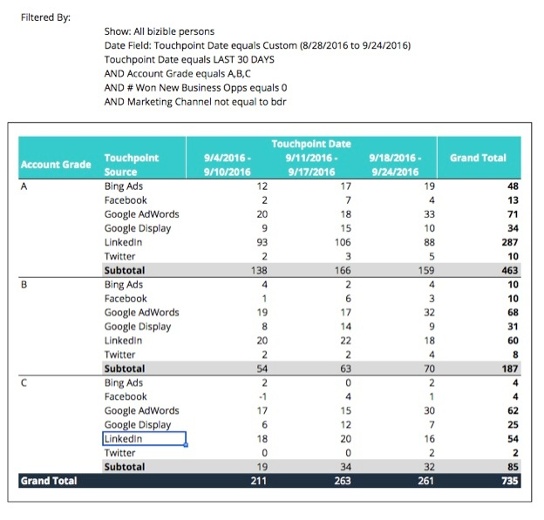
This is a report that shows touchpoint volume (read: engagement) by paid media subchannel, organized by account grade, within a certain span of time. This is an excellent way for a paid media manager to assess the overall quality of account grade engagement with their paid media channels.
Problem:
What report should account-based marketers use to see granular engagement metrics on all subchannels?
Solution:
Create a touchpoint engagement report that is filtered by touchpoint source (or marketing subchannel) and account grade.
A paid media manager’s channels include paid search, paid social, and other ad networks. This report shows one month’s engagement of contacts from accounts within grades A, B, and C.
Start by creating a contact report in matrix format. Set the Account Grade field as the row grouping and Touchpoint Source as the row sub-grouping. To see how the data changes over time, set the Touchpoint Date field as the column grouping and choose to group it in one-week segments. Finally, drop Touchpoint Count into the middle to populate the table.
To only see touchpoints from A, B, And C accounts, add the following filter: Account Grade equals “A, B, C.”
Ingredients:
- Account Grades
- Subchannels or Touchpoint Source
- Touchpoint Record Count
- Time Frame: Based on Touchpoint Create Date (last 30 days for monthly reporting), grouped by week
Whether you lean more towards account-based marketing or demand generation, every marketer can benefit from understanding how to track the entire sales cycle.
Stay tuned as we continue our series of marketing performance measurement and reporting. You can get the entire e-book to conveniently read anytime by downloading it using the link below.
Read more:


