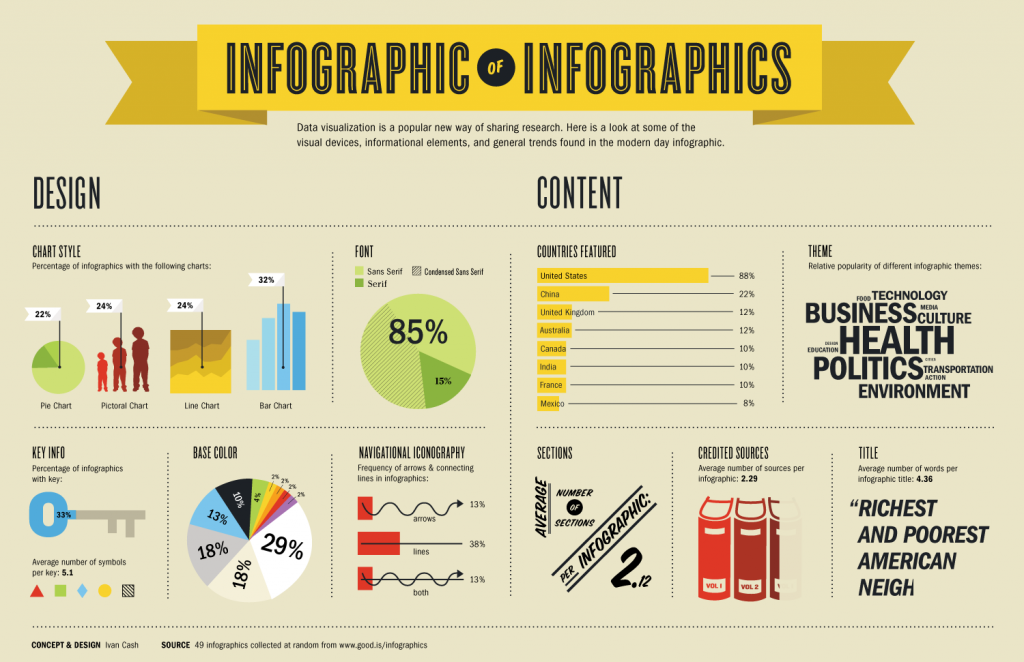
You’ve probably heard the buzz in recent years: ‘copywriting is dead!’ But what does that really mean? Can copywriting truly be gone? The answer is…sort of. What people are really saying is that keyword stuffing and SEO copywriting are no longer effective. While that’s mostly true, it also means that content marketing is thriving.
Google’s new Hummingbird algorithm has signaled a shift from keyword dense blog posts to longer, richer content that semantically engages its audience. This shift has specifically placed an emphasis on infographics and images, which begs the question: Are you utilizing infographics to engage your audience and promote thought leadership?
The History of Infographics and Data Visualization

Visual representation of statistical data is nearly four centuries old, but it wasn’t until the internet came along that it reached its most influential peak. With so much aggregated data and visual design capabilities in one place, infographics have quickly become the most effective and popular form of data visualization. What began as a simple way to visualize information has become, to many, the preferred way of consuming information. In fact, the popularity of infographics has more than doubled in the past two years. It is that popularity that has caused Google (the great director of content marketing and SEO) to place a larger emphasis on data visualization. Why? Because infographics are engaging and compelling storytelling mechanisms; the very thing Hummingbird is trying to hone in on. Are you taking advantage of this shift?
What Makes a Good Infographic?
While all are different, there are a few key ingredients every effective infographic has:
- Unique idea – An effective infographic starts with a unique idea. Chances are, whatever you want to do has already been done. That means you need to figure out how to tell that story in a new, interesting way. A successful infographic can’t simply repeat what’s already been said.
- Bold and stimulating – Boring infographics are unattractive and ineffective. You need to create something that is aesthetically pleasing and intellectually stimulating. Your audience is going to judge the infographic on appearance first and content second. Give them a reason to stick around for the content.
- Shareable – If you are creating infographics, odds are you want it to be shared and circulated. Keep that in mind in the creation process. Is it too big? Can it be easily searched? Is it social media-friendly? According to this infographic, an infographic has the potential to reach up to 15 million people via social networks.
What an Infographic Shouldn’t Do
While the previous three ingredients typically lead to a successful infographic, there are also some things to avoid:
- Recycled information – There is a difference between being inspired and being a copycat. There’s usually not room for two infographics providing the same information. If you find a topic you like, put an original spin on it.
- Forgetting the audience – Not many people create infographics just for fun. You want your work to be consumed and shared. Keep your target audience in mind when creating an infographic.
- Poor visuals – While your infographic needs useful and meaningful content, it also needs to be visually appealing. Poor visuals and confusing layouts are a quick way to run an infographic into the ground.
The Future of Infographics in Copywriting
As mentioned before, Google Hummingbird has increased the focus on content rich, visually appealing webpages. One industry expert says, “It has now become an accepted fact that the more visual components an article or piece of content has the more likely it is to draw attention and be read.” He goes on to explain that certain sites now require their writers to include at least five photos or images in a 1500 word article.
With more information circulating the web than ever before, people have started to actually read less and browse more. But they are becoming more and more skilled at skimming, meaning they sift through the text and look for appealing tidbits and pieces, which is essentially what infographics are. They are a collection of appealing tidbits in a visually appealing format. That gives them an advantageous foothold in copywriting and marketing.
More than Sexy Marketing
So far it may sound like infographics are simply a marketing technique, but they can be much more than that. They are becoming a preferred method of sharing and promoting thought leadership. After all, the core components of infographics (unique, bold, and shareable) are consistent with the fundamental principles of thought leadership. That means effective use of infographics can please search engines, help with marketing, and promote thought leadership at the same time. Sounds pretty good!
When trying to establish yourself as a thought leader in a sea of ‘experts,’ try to differentiate yourself from the pack. Strive to be different and engaging. How? Why not try the infographic route? It is a unique way to inform your target audience, build brand awareness, and make a mark.
While SEO copywriting may be dead, content marketing is just finding its place. And in its search for audience engagement, content marketing has found infographics and data visualization to be effective partners to rich, quality content. If you’re trying to find your niche as a thought leader, turn to infographics to set yourself apart from the clutter of information on the internet. They may just be the future of copywriting.
