Talk to any B2B marketer about attribution and they’ll either roll their eyes or rant about how it’s important but hard to get right—long lead cycles, multiple contacts from a single organization, etc.
Some might stare blankly and ask what you mean.
As a group, we’ve gotten a firmer grasp on top-of-the-funnel metrics. We can prove that social media and SEO drive traffic and top-line conversions, but we still struggle to show the bottom-line impact of marketing.
To get marketing a seat at the table and prove that it can drive revenue and pipeline, we’ve become borderline obsessed with numbers. The accuracy of those numbers, however, depends largely on the quality of our attribution model.
What is attribution?
Attribution takes marketing analytics a level—or a couple levels—deeper. If we look at the hierarchy of marketing data, it goes something like this:
-
- Acquisition (e.g. site visits)
- Engagement (e.g. bounce rate)
- Conversions (e.g. form fills)
- [Black box]
- Revenue
As marketing moved online, we got decent at tracking link clicks and website behavior, but we still struggle to connect the dots between someone visiting a website, taking an action, and becoming a customer.
To reframe marketing as an investment rather than a cost center, we must connect all the dots to revenue—but it’s hard to do without the right tools and models to get started.
No marketing attribution model is perfect. The prospect-to-customer journey is not a linear series of events; it’s hard to predict and measure every engagement. However, some visibility is better than none at all.
Why do I say that? Too often, in my in-house and now consulting days, I talk to clients and executives who want to know how much each dollar spent brings back in revenue and which channels and activities generate the largest return.
That’s the dream—but it’s nearly impossible to do with 100% accuracy.
The non-linear user journey
Marketers like to work with frameworks. The traditional marketing/sales funnel (soon to be replaced by Hubspot’s Flywheel Model) is a fantastic framework to put things into perspective.
But it wrongly assumes that people go through the funnel in a straight line. In fact, they take all kinds of detours. Since the journey isn’t linear, it’s impossible to determine exactly which touchpoint generates revenue for each client account.
Here’s what I mean:
- Prospect A sees a Facebook Ad for your newest blog post and clicks through. She reads the post but doesn’t opt in to your newsletter, free trial, or any other offers. She might have gotten up to go to lunch. (Attribution: Paid social)
- Three days later, she sees someone share the same blog post via Twitter and goes back to it through the Twitter link. (Organic social)
- She becomes a lead a week later after seeing your display ad on NYTimes.com, but as she types your URL into her browser, the URL auto-completes. (Direct)
- After she gets a series of lead nurturing emails and sales/marketing communications, she signs up for a demo and converts into a paying customer. (Email)
Which touchpoint generated the highest return? Was it the Facebook Ad, which got her interest in the first place? The Twitter post? Or a whole bunch of other things she might have seen in the meantime? How do you justify the Facebook Ad spend or social media manager if you can’t tie their work to closed deals?
This challenge is why you need some form of attribution modeling. Otherwise, you’re just looking at top-of-funnel traffic and conversions—not how those channels intersect to generate pipeline and revenue.
A case study on the need for attribution
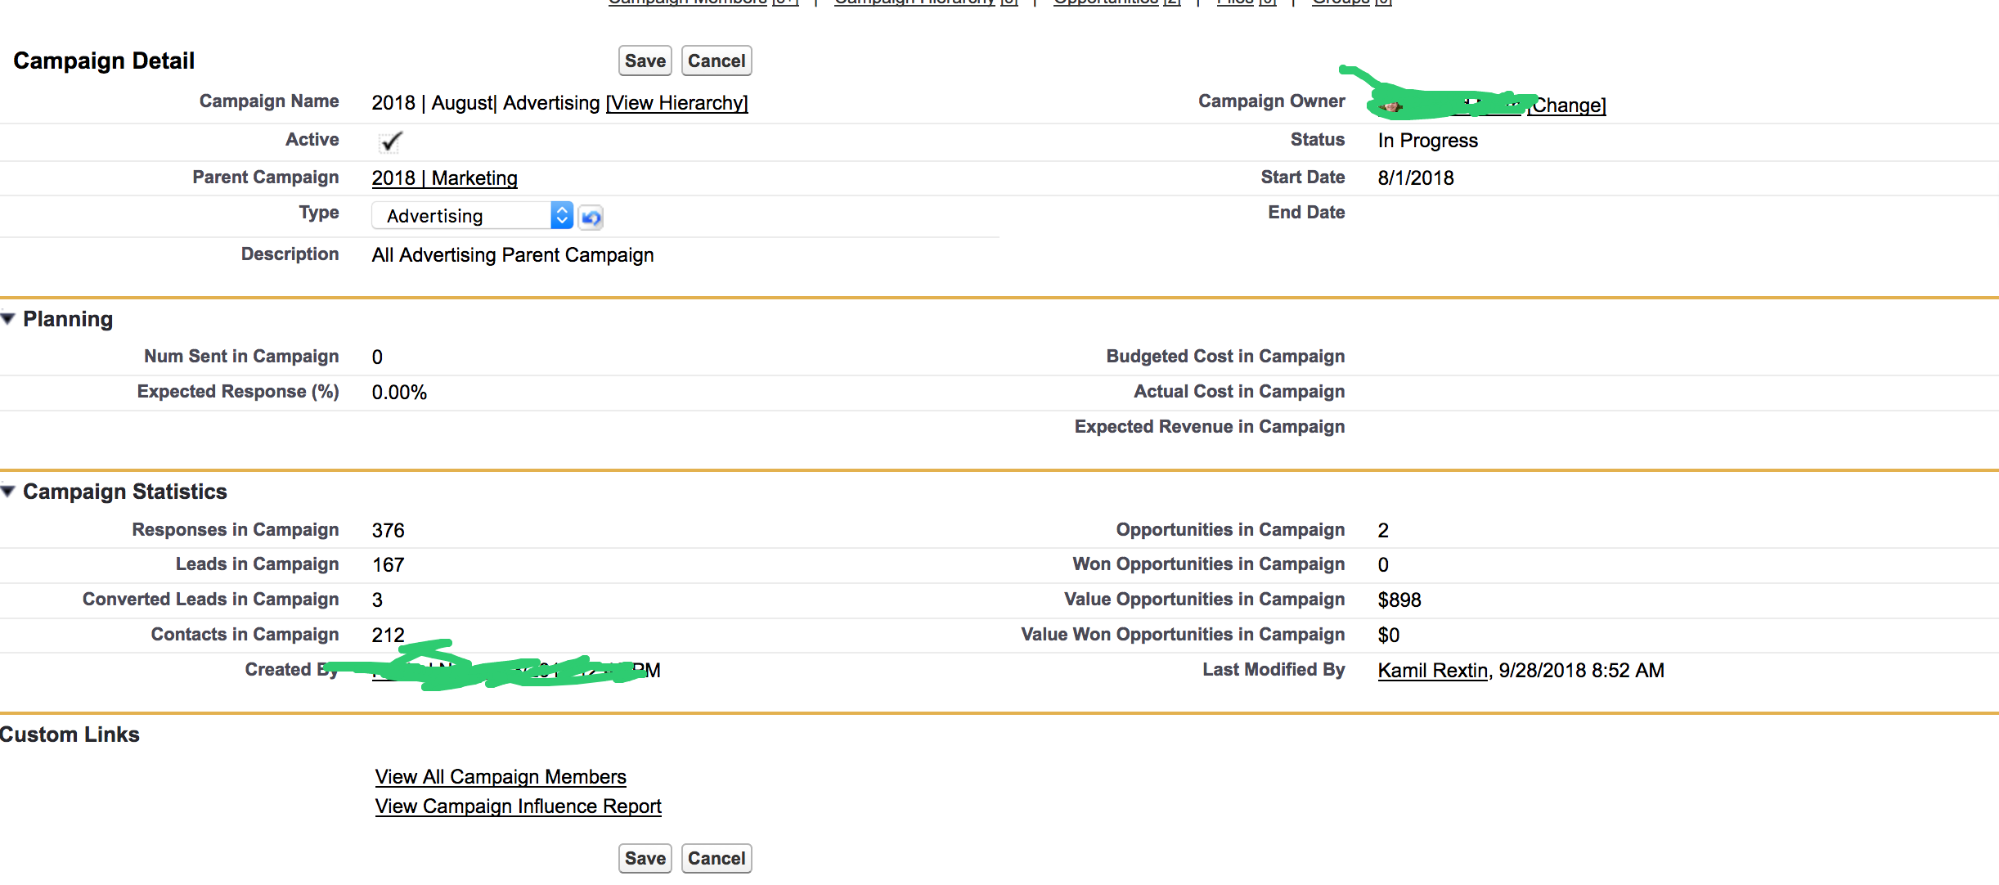
One of the companies I consult with spent a lot of money sponsoring conferences. One in particular was highly regarded in the industry—it had the right titles and personas in attendance, so this client spent $50,000 on an annual sponsorship. It was a significant chunk of the marketing budget and came at the expense of other channels.
They measured success by the number of attendees, which they counted as net new prospects. One of the first exercises I did with them was to create an attribution model to measure trade show success. Using Salesforce (which I dive into below), we created a report on how the event drove net new pipeline and whether it moved existing opportunities toward closed sales.
After looking at the data across 3–6 months (the average sales cycle), it became clear that—even though the campaign was a “success” based on the number attendees—it drove a relatively low percentage of pipeline revenue.
Attribution took a top-of-funnel metric (net new prospects) and dove deeper to determine how much revenue we actually drove, which proved to be less than the investment.
As a result, the team changed how it approached the event. It was still important for the brand and getting face time with customers and prospects, but they reduced their sponsorship amount.
The same argument can be made for any marketing activity:
- Maybe Twitter is bringing in a lot of traffic, but it’s actually Twitter combined with a brand search that drives conversions.
- Targeting someone with ads leading up to a conference may make them more likely to come by your booth and chat with a team member.
Without attribution, you would wrongly assign all the credit to Twitter or the trade show.
What to focus on for marketing attribution
There are different ways to look at attribution based on how you slice and model the data. The critical touchpoints in B2B are the transition stages in the customer journey:
- First Touch. Where did the first anonymous visit come from? This gives you an idea of which channels generate top-of-funnel traffic and brand awareness.
- Lead Creation. A visitor submits some kind of form with their email, name, or other information to become a known lead.
- Opportunity Creation. When you add an opportunity to your CRM (i.e. an account executive thinks the prospect is a good fit and likely to buy).
- Closed-Won. When an opportunity closes and becomes a customer.
(Note: I borrowed some terminology above from Bizible)
You can track other stages, but the point is not to track every stage; otherwise, you’ll have too much noise. Focus on the stages you care about most and what drives the stage change.
How to model attribution
Your entire customer journey is worth 100%. Different models assign different percentages to each touchpoint.
For example, if you have five touchpoints, a Linear Model will assign credit equally across all touchpoints—each engagement is credited with 20%. You can also break this down by revenue: If a deal is worth $1,000, then each touchpoint or engagement is worth $200.
Here’s an overview of the different models:
- First Touch. How did the visitor first come to your site?
- Last Touch. What was the last touchpoint before Lead Creation?
- Last Non-Direct Click. This excludes direct traffic as an attribution source.
- Last Google Ad Click. This is specific to Google Analytics.
- Linear. Equal credit is given to all touchpoints.
- Time Decay. The most recent source to Lead Creation gets the most credit.
- Position Based. Sources for First Touch and Lead Creation get the most credit; the rest is evenly distributed.
- W-Shaped. Specific to B2B and looks at only three engagements: First Touch, Lead Creation, and Opportunity Creation.
(CXL has a fantastic article explaining the different attribution models in detail.)
No model is the “right” one. It depends on the context of your business and how you prefer to measure. And remember: While not perfect, each model is better than not having any framework in place.
Tools to measure marketing attribution
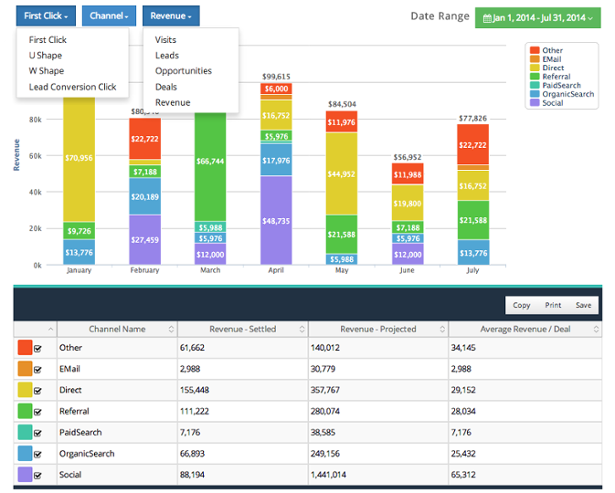
Salesforce and Salesforce Campaigns
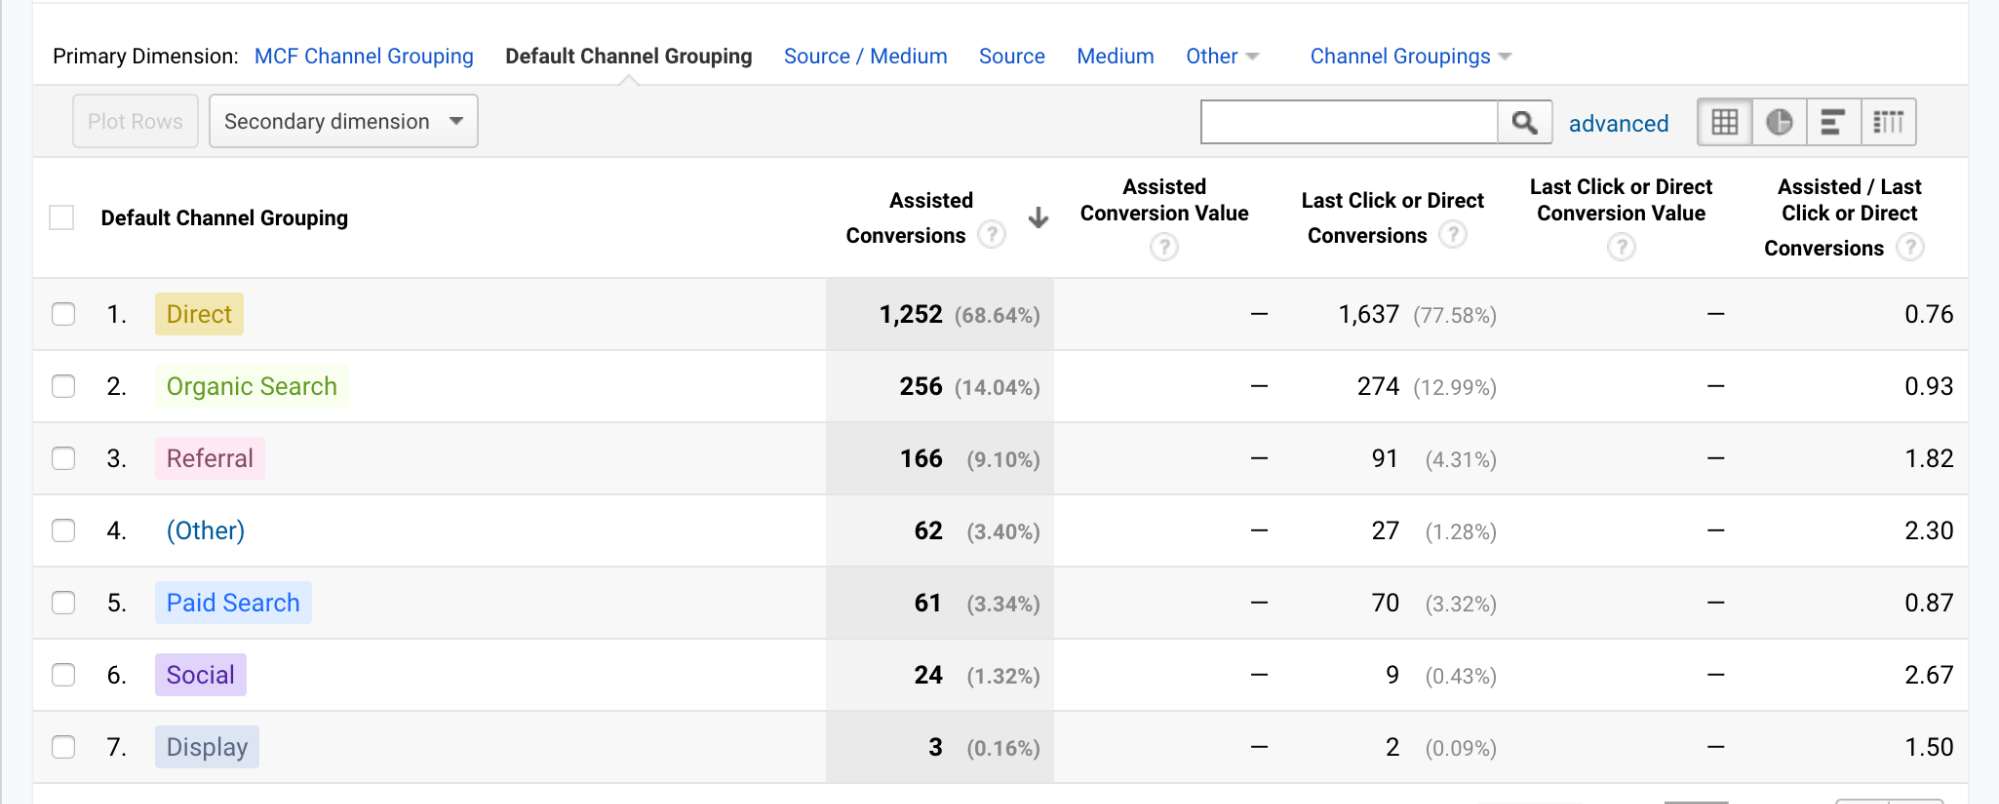
 For B2B businesses, managing individual contacts within an account is crucial for attribution.
By far, Salesforce is the most widely used CRM for B2B businesses. But one of its limitations is relying solely on the lead source for attribution.
Here are the issues that can arise:
- If the lead-source assignment is a manual process, you leave it to someone’s judgment. And if you measure only the channel that created the lead, you don’t capture what drives that lead to become an opportunity.
- Lead sources may get “dropped” when a lead is converted into an opportunity. Account executives may overwrite lead sources when they create an opportunity.
- In B2B, you’re measuring attribution at the prospect level and the account level. Selling to companies adds complexity to the Lead Source method. In Salesforce, you can report on objects (Contacts/Accounts, Opportunities, Leads) but not across objects. So should you track top-of-funnel lead sources then use account sources to show how the company ended up buying? One method is to add a primary contact(s) source in the “Account Source” field. But this relies on a contact hierarchy in the account object to determine which one is the primary.
- Reporting from a single field misses all the touchpoints in the middle that resulted in the opportunity. You’re limited to reporting on a single object at a time; the sales process doesn’t match that.
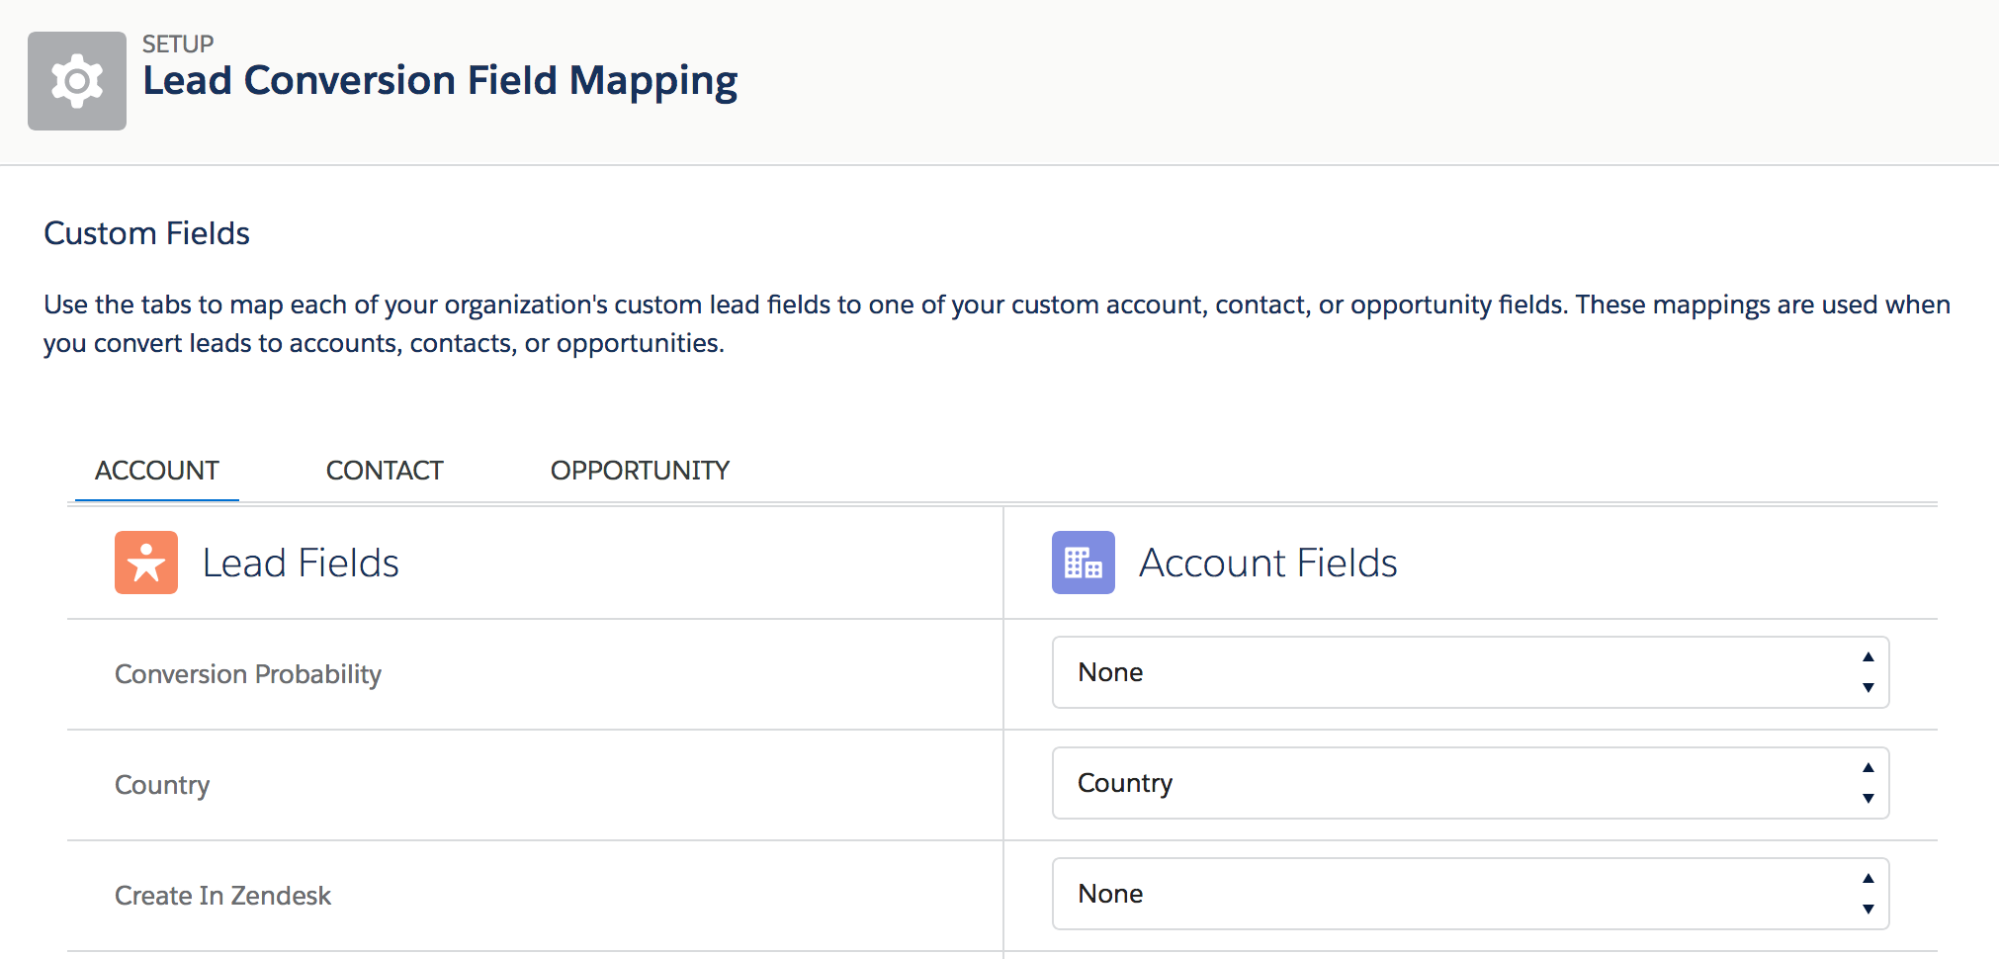
 Field mapping between Objects in Salesforce.
Thankfully, Salesforce Campaigns solve these issues brilliantly, allowing for:
- Cross-object reporting. Report on Salesforce Campaigns across Leads, Contacts, or Opportunities to see how many of each (as well as, ultimately, revenue) each campaign generated.
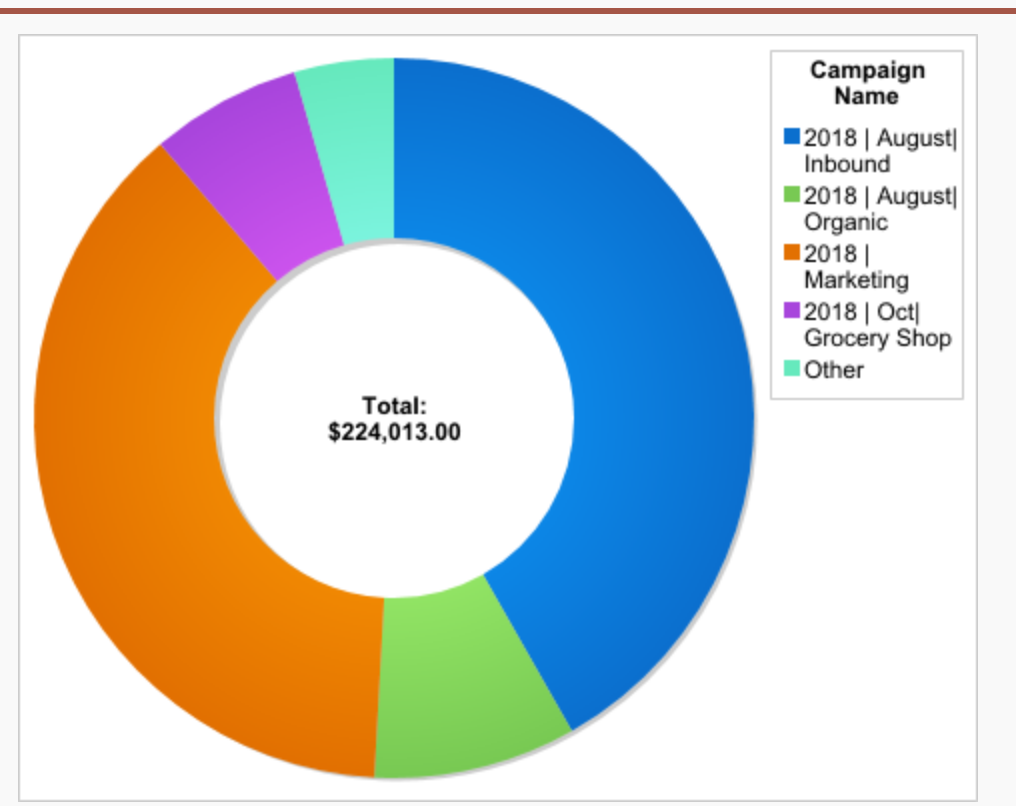
- Campaign Influence reporting. Break down all the campaign touchpoints associated with an Opportunity. (A Campaign object is not a 1:1 mapping but a 1:many mapping.) This lets you determine that to close Company X, prospects touched Adwords, branded search, attended events, and interacted with Social Ad campaigns.
- Parent and Child Campaigns. Roll up reporting for “’All Marketing Campaigns” and break it down by each campaign. You can create campaigns for Sales/Marketing types and set up hierarchies that make sense for your process.
For accurate reporting, you need to capture every touchpoint and assign it to a Salesforce Campaign. But you also want to avoid setting up and managing hundreds of campaigns.
To make the process simpler, you consolidate touchpoints. For example, paid media (Google Ads, LinkedIn Ads, etc.), events and tradeshows, and webinars are all important to track independently. But maybe you can bundle newsletter and marketing emails (outside of nurtures) into a single campaign.
It’s also important to use relevant campaign statuses. So if it’s a webinar, set up custom statuses to track how many registered, attended, or were no-shows (versus relying on the binary, out-of-the-box “sent/responded’ statuses). To make this process more efficient, I set up campaign templates to easily replicate statuses in the future.
Hubspot, Pardot, and Marketo Campaigns
You can set up attribution for marketing automation tools, too, and connect them with Salesforce to trigger campaign assignments.
HubSpot
Hubspot lets you create attribution models in a couple of ways: Original Source and HubSpot Campaigns.
Original Source. Original Source tracking tells you which channel a prospect came from before becoming a known contact. It relies on a cookie that’s added to a prospect’s browser when they first come to a web property with a HubSpot tracking code.
When they fill out a form, HubSpot ties the cookie to a known contact in its system to give you a complete picture of how the user first came to your site, how long it took them to convert, and where they converted.
You can take this a step further and attach UTM parameters to all links for all channels. Those parameters show up on form submissions, effectively offering First Touch and Lead Creation attribution to show, for example, that a contact came from Organic Search but then converted from Google Ads.
How does this look in practice? Suppose I came to your website through Twitter, and a week later I converted through a Google Ads campaign. Reporting from those two fields gives you two touchpoints—what first caught my attention and what led me to convert. Without tracking both, we’d mistakenly give 100% of the credit to Twitter or Google Ads.
To track which source drove a contact to become an Opportunity or a Closed-Won, we can create an automation workflow that stores the UTM value in a field called “Lead Creation Touch.” When a stage changes from, for example, Lead to Opportunity, we can write the value of the UTM parameter into “Opportunity Creation Touch” and determine the three touchpoints—Original Source, Lead Creation, and Opportunity Creation.
Reporting all of these will give you a more complete picture of the journey from anonymous visitor to customer.
Hubspot Campaigns. Hubspot has recently expanded reporting to break down First Touch, Influenced, and Customers sources by the campaign, enabling reporting on overall campaign performance:
Pardot
Similarly, in Pardot, you can assign Pardot Campaigns based on Source Tracking or Custom Redirects. You can use either to track contact touchpoints from First Touch to Lead Creation and, ultimately, Closed-Won.
At present, Pardot doesn’t offer an Original Source tie as Hubspot does for anonymous visitors. But there’s a workaround: Create Custom Redirects for high-value campaigns and write in the Pardot Campaign and Source values for anyone who clicks on that link. The Pardot cookie can tie that Custom Redirect Source back to the contact after they become a known lead.
For a client who uses Pardot, I connected Google Analytics and Google Ads to Pardot to add UTM and GLICD parameters. After capturing UTM values, we set up automation rules to write the source values on the contact based on the UTM value combinations and assigned them to specific Salesforce campaigns based on that data.
I write the values into a source field rather than reporting directly from UTMs because:
- We want to use a system and naming convention for sources.
- UTM values get overwritten when a prospect clicks/converts through a new tagged link. The source value fields can be locked to preserve every touchpoint.
With Pardot, you can also track keyword-level performance through their Google Ads Connector.
Marketo
Marketo offers two methods. One is Programs, which are similar to tracking statuses in Salesforce Campaigns. You can use tracking parameters to set Program memberships and statuses to determine how your programs perform over time.
However, Marketo Programs don’t offer a multi-touch report like Salesforce Campaigns. You can use a bit of JavaScript to write source values into the Marketo cookie (Munchkin tracking) for the specific browser and tie it back to the contact when it’s created.
The power of using Marketing Automation and Salesforce campaigns becomes apparent when you use your marketing automation tool to capture and assign Salesforce campaigns based on source/referral/medium values.
Google Analytics
Google Analytics (GA) is perhaps the most widely used yet underutilized tool for web analytics.
Ninety percent of the time I audit client GA setups during onboarding, they’re missing Goals. Goals tell GA what’s important to your business and let you track things like form submissions or trial starts, allowing you to see, for example, how many people from Twitter actually convert.
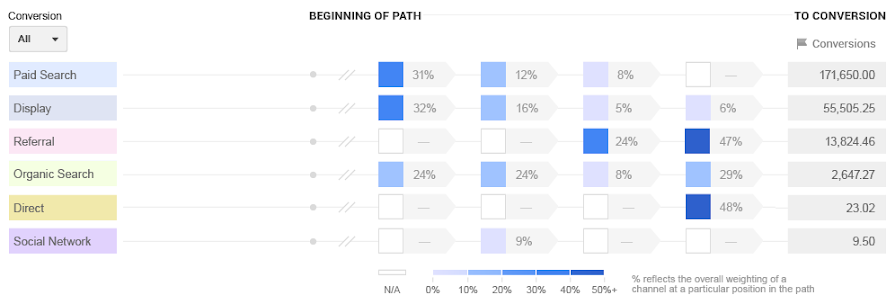
The other reason Google Analytics is so powerful is that once you set up Goals, you can create Multi-Channel Funnels to view which interactions (based on channel, parameter, etc.) lead to conversions.
Here’s what a Multi-Channel Funnel report looks like:
You can see that Direct traffic assisted a lot of conversions (expected), but if we look a level deeper, it shows that Organic Search, Paid Search, and other channels also assisted conversions.
As I mentioned, a customer’s path to purchase is not a straight line. What this tells us is that—of all the conversions during this time—prospects engaged across these channels most often.
So, a prospect might have:
- Seen a Display Ad.
- Clicked on a Referral Link (from content on a third-party site).
- Seen a Google Search Ad.
- Ultimately converted via Direct traffic (which includes any visit without source data).
This gives is a clearer picture of all the paths a prospect took before converting. You can slice this data by segments, parameters, device, location, landing page etc.
A note on Direct traffic
This is a great opportunity to understand what Direct traffic means and if there’s a spillover effect from other campaigns. Most marketers curse Direct traffic since it doesn’t show you where it came from or what caused it. However, if you combine Direct traffic data with GA Multi-Channel Funnel reporting, you can see some insights.
For example, a recurring trend I’ve seen is an uptick in Direct traffic when Facebook Ads are running. A hypothesis (which was validated by a correlation analysis) confirmed that Facebook Ads indeed spiked Direct traffic.
This could be because prospects who see ads on Facebook are more likely to go to a site directly or via an untagged URL, or that there were higher-than-reported conversions from Facebook Ads due to session expiration.
Even more opportunities in GA
This is what makes GA conversion paths so powerful. With marketing automation tools or Salesforce, you cannot layer in additional data because it’s simply not available. But in GA, you can add more data to segment your channel report and really understand the user journey toward conversion.
The Top Conversion Paths report shows you the sequence of channel interactions prior to conversion. Additionally, the Path Length report gives you an idea of, on average, how many engagements a prospect has before converting. (The answer may surprise you.).
A third powerful tool in GA (though one that’s not directly related to attribution) is the Time Lag report. If you run a lot of retargeting ads (which you should be running), the Time Lag report shows you how long it takes for someone to convert.
In one of my consulting engagements, a client ran tons of retargeting ads on prospects who had visited the site in the past two days. However, looking at the Time Lag report, we saw that 30% of people converted 5 days after coming to the site. Changing the strategy from a 2-day to a 3–7 day window increased our remarketing ads’ performance by 25%.
Note: By default, the “look-back window” or “attribution window” in GA is 30 days, so GA will look at a 30-day window to create the first-visit-to-conversion path.
Google Attribution 360
 A report showing weighted attribution in Google Attribution 360’s Model Explorer.
At $150k per year, Google Analytics 360 doesn’t make sense for most businesses. For those it does, however, it offers vastly improved attribution modeling.
Google Attribution 360, the attribution system within Google Analytics 360, uses machine learning to create a custom attribution model based on data from all connected accounts: Google Ads, Google Display Network, Campaign Manager, etc.
Attribution 360 also folds in offline data, like the impact of television advertisements; allows you to upload spend data from non-Google accounts; and extends the look-back window beyond 90 days, more than three times past the standard in Google Analytics.
The Model Comparison Tool compares three potential models to see how each affects the valuation of marketing channels. You can also create custom rules for attribution models, then reallocate marketing spend to test the validity of the proposed model.
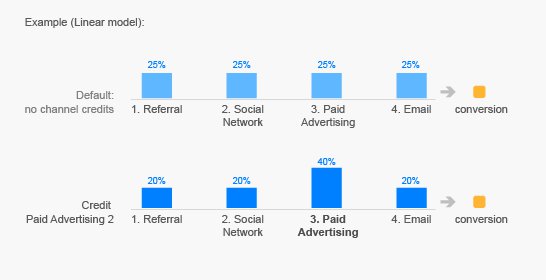
A comparison between a Linear attribution model and one in which Paid Advertising receives additional credit.
Google Attribution is a free, lightweight, but not-yet-released version of Google Attribution 360. According to plans, it will connect data from Google Analytics, Google Ads, and Campaign Manager accounts—without additional tagging.
Google intends to roll out the free version, in part, to help advertisers better understand the impact of their ads (and, presumably, encourage them to spend more by showing the role of events like ad impressions in driving conversions).
Bizible and other enterprise tools
If you want to take attribution a step further and have the budget to do so (about $25–40K annually), you can add Full Circle Insights or Bizible to your existing suite of tools.
Bizible adds a layer of extra reporting and custom objects into your Salesforce data. But note that Bizible is built on top of Salesforce campaigns, so if you don’t have Salesforce or are not using Salesforce Campaigns, then Bizible isn’t for you.
Bizible creates touchpoints for each Salesforce campaign and maps them along the attribution journey (First Touch, Opportunity Creation, etc.). You can create different models or even your own model (with higher-tiered plans).
Bizible shines with its native Google Ads integration, which pulls in cost and revenue data from Salesforce to give you a true return-on-spend visualization:
You can also set up matching rules to add UTM parameters to custom touchpoints (like campaigns that turn leads into marketing-qualified leads). Since all this is native to Salesforce, you can create dashboards and reports based on campaign/channels to gauge performance accurately.
However, Bizible is an enterprise tool—not every business needs it to create a functional attribution model. As with any system, make sure that the data inputs are clean, or you’ll end up with a “garbage in, garbage out” scenario.
Also, Bizible lacks native Facebook Ads integration. Facebook has been a strong channel in a lot of B2B consulting work I’ve done, so, for now, you’ll have to add the costs and rules manually.
Attribution windows: Google Analytics and Facebook Ads
I mentioned attribution windows briefly. What are they? Attribution windows are the timeframes in which, if a conversion occurs, the credit will be given to the channel(s) involved.
For Google Analytics, it’s the timeframe (30 days) in which Google Analytics traces back to the First Touch from the date of conversion.
To understand attribution windows, let’s look at a Facebook Campaign. If a prospect:
- Clicks on one of your Facebook Ads;
- Doesn’t convert right away;
- Then comes back to your website and converts within a 30-day window;
Facebook will record it as a conversion in the Facebook Dashboard and optimize around the event.
Let’s break it down a little more: If a prospect clicks on an ad and then converts anytime in the next 30 days, Facebook will record it as a conversion. Why? Because Facebook influenced the conversion (and because Facebook, as a platform, has an interest in taking credit for that event).
You can customize attribution windows for Facebook Ads, Google Ads, Adroll, and other paid media channels, but this is why Facebook often shows one number for conversions but your data shows another—the attribution windows between your two platforms don’t align.
Another reason is the difference between view-through conversions (VTC) and click-through conversions (CTC). Most ad platforms count people who saw (VTC) or clicked (CTC) an ad within a certain timeframe as converters. Adroll breaks it down, but some don’t—keep that in mind when you’re attributing paid media spend back to pipeline revenue.
Where to Start
Start somewhere. Anywhere. If you aren’t properly tagging and capturing UTM or other parameters, start there:
- Have a consistent naming convention
- Be strict about what goes into each field and what it means.
- Get every team (social, demand, creative) to tag links
- Never share “naked” links, which pollute your data with Direct traffic.
Establish a single source of truth for your data. Most of my clients ask why a number in one tool doesn’t match another. There are a lot of reasons; different systems measure things differently.
One example is Facebook conversions versus prospects created. Another is how Hubspot measures website traffic versus GA’s approach. (GA doesn’t filter for internal Hubspot pages and previews.)
- Pick a tool to report from and stick with it.
If you’re going to report new leads from social ads via your CRM, ignore the Facebook reports (but be aware that some Direct traffic might be Facebook-influenced).
Accept the limits so that you don’t spend your time trying to find the right data but instead spend it gathering insights and making decisions.
- Decide on terminology, like what “influenced” versus “created” means for your attribution model.
It’s easy to get lost in the details—but it’s never worth it.
Most importantly, remember that a prospect’s journey from visitor to paying customer isn’t linear. Plenty of “assist” and “influence” channels don’t get captured by tracking codes.
Branded search is a classic example. If a rise in branded search correlates with a marketing campaign, there’s a high probability that you’re generating a lot of word of mouth and, as a result, branded search. If you look at campaign results in isolation, you may think it underperformed.
Conclusion
Increasingly, as marketers, we’ve become “data-obsessed,” but sometimes we lose sight of the big picture. Data and tracking are meaningless without context, and not every action can be measured—no attribution model is perfect.
If you’re not currently connecting marketing spend with results, start somewhere. You don’t need enterprise-level tools. Google Analytics is a great place to start and make a case to your organization for how marketing drives bottom-line results.
Alternatively, you may already be doing it but know you have blind spots—every company does. Find out what you don’t know. Just don’t forget to improve the value of what you do know.