Do you know if what you are doing to market and grow your startup is actually working? While ‘trusting your gut’ is essential in entrepreneurial success, trusting it alone can be fatal. By defining and tracking KPIs, you can help ensure that you are indeed headed in the right direction and getting the results that matter to your startup’s success.
The What
In a world full of data, it can very difficult to know what to track. Just because you can track everything, doesn’t always mean you should. Most companies track so much that the loss focus on what matters the most. This is why defining KPIs is so important.
According to Kilpfolio, A Key Performance Indicator is a measurable value that demonstrates how effectively a company is achieving key business objectives.
The key part of the definition above is “business objectives.” Every company has different goals and should have different KPIs. The first step to know what to track as a Key Performance Indicator is by first have a clear grasp on you businesses objectives.
For example, if one of your business objectives is to grow the number of users on your platform, “Number of New Users per Month” should be a KPI for your company.
Another important thing to remember is that you should limit the number of KPIs. No less that 5. No more than 7. If everything is important, nothing is. So after your know your objectives, start brainstorming what you need to measure. Then organize your thought into buckets based on their importance. This will help you narrow down your list and enable you to focus on what matters most.
The Why
Just tracking number for the sake of tracking them is going to do you little to no good. You have to embrace data as a pillar of your business. When you have the right KPIs, they can assist you in your decision making process.
While trusting our own gut is powerful, when we can back that with data it makes it much easier for your team to embrace the vision. It’s also helpful when the data shows the opposite of what we are feeling. This gives us a chance to slow down, think a little more about our options and make a smarter decision.
Another reason being data-driven is important is that it helps us reach our goals. Having a “north star metric” for our company is great, but the only way of knowing if we are headed in the right direction is with using data.
You think of a North Star Metric like your ultimate KPI. Growth Hacker Sean Ellis describes it as so. “The North Star Metric is the single metric that best captures the core value that your product delivers to customers.”
This North Star Metric should be your top KPI and something everyone on you team know where you stand on. Using a dashboard, you can share your KPIs with your team in real time. This build trust, transparency and helps keep everyone on the same page.
The How
There are a lot of BI tools you can use to create dashboards and scorecards with your KPIs. The problem for many startups is that these tools are extremely expensive and do a lot more than they need to do.
I have found a great tool that you can get started using for free. It’s called “DataBox.” Below I’ll show you how to get started with the tool by setting up a dashboard and scorecard.
Step 1: Sign Up @ https://databox.com/
After entering your details, you’ll be brought dashboard. This is your home base for databox and will be where you can see and interact with your databoards once they are set up. The first step is to hook up you data sources.
It’s important to note, that your free account includes only 3 data sources and 3 databoards. So start by adding the connections that matter the most your business objectives and KPIs.
To add data sources, simply click “data manager.”
As you can see, they have a lot of connections to choose from. Click “connect now” to get started.
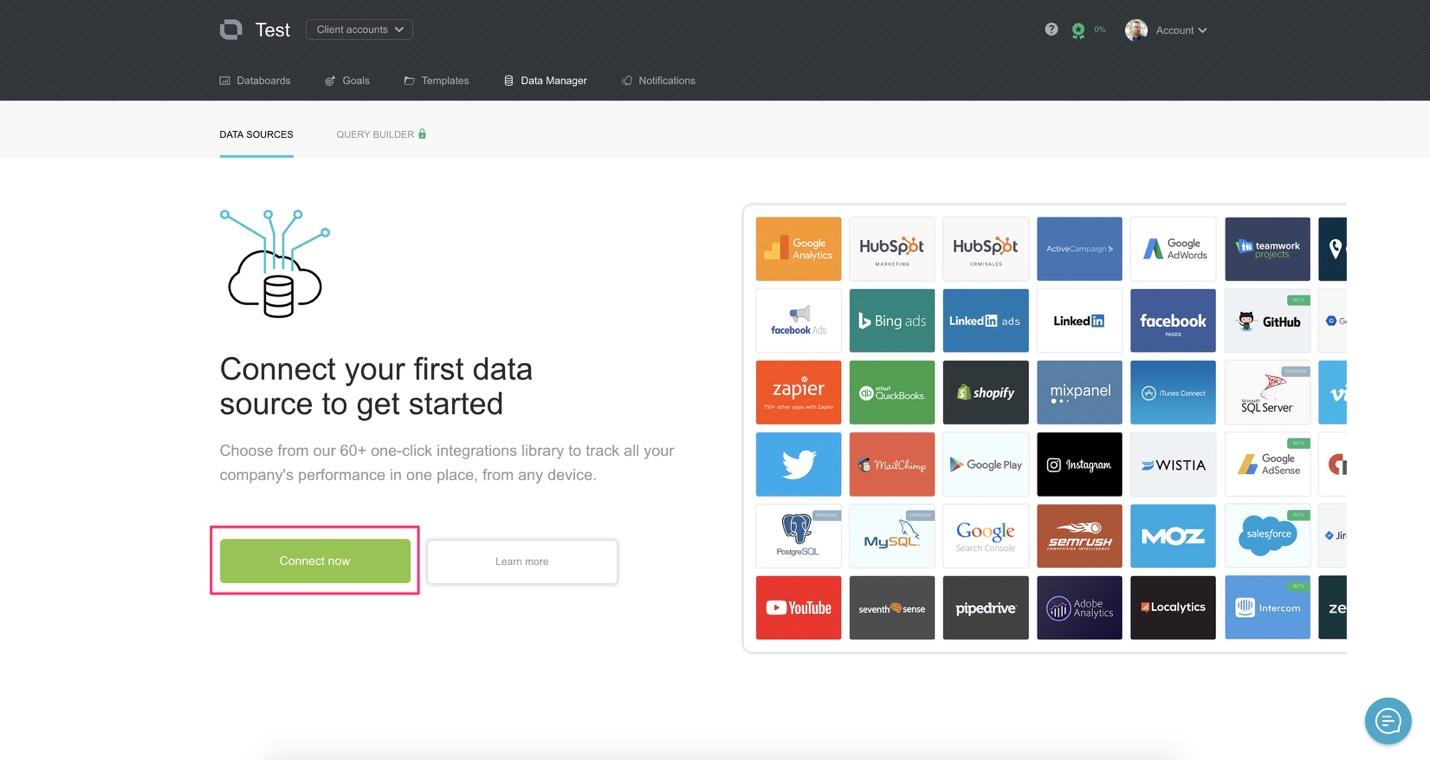
Now, choose the data source you want to connect to and follow the on-screen steps. For the purpose of this post, I am going to just use Google Analytics, but feel free to connect to the sources that matter most to you!
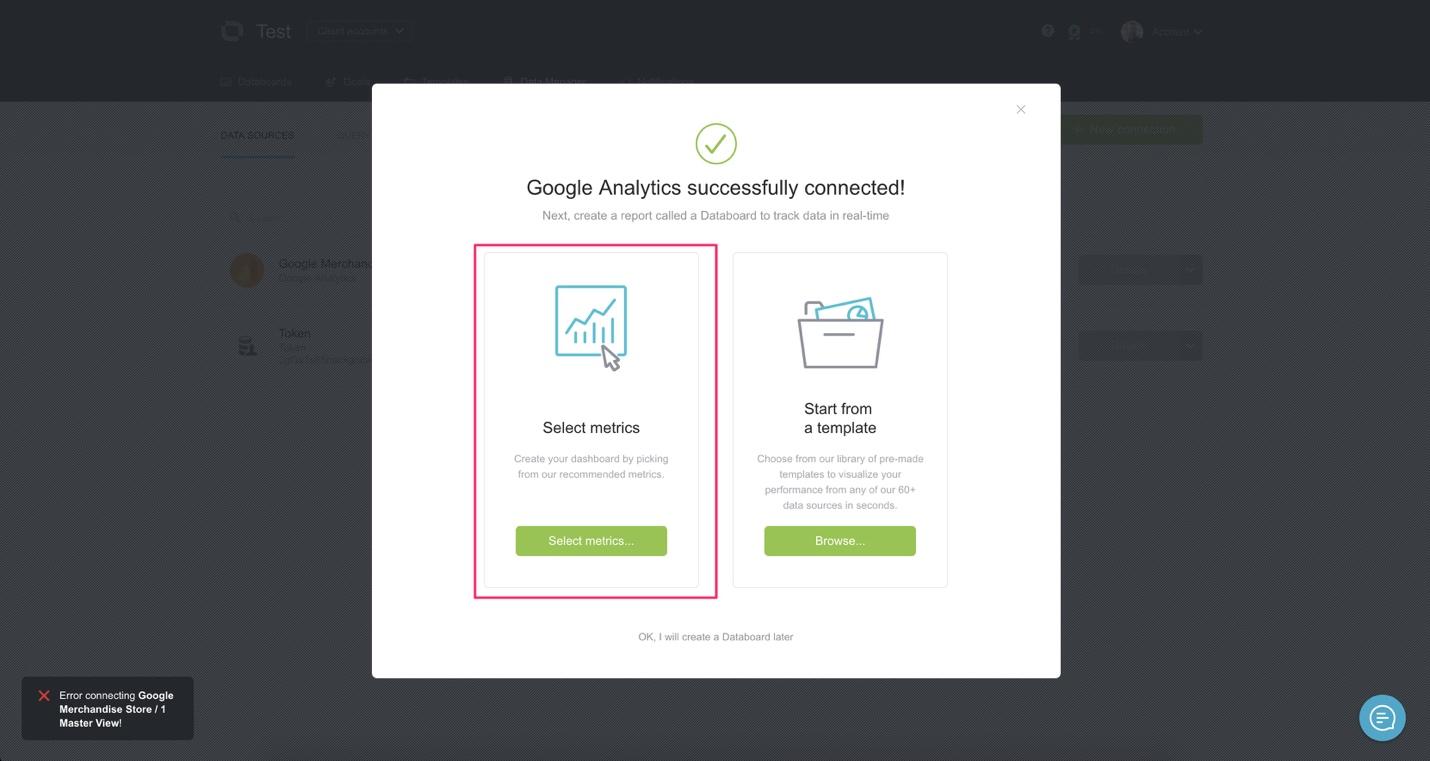
After you have connected your data source, you’ll be asked if you want to start from scratch or use a template. Since KPIs are very business specific, choose “Select Metric”. You can always browse the templates later.
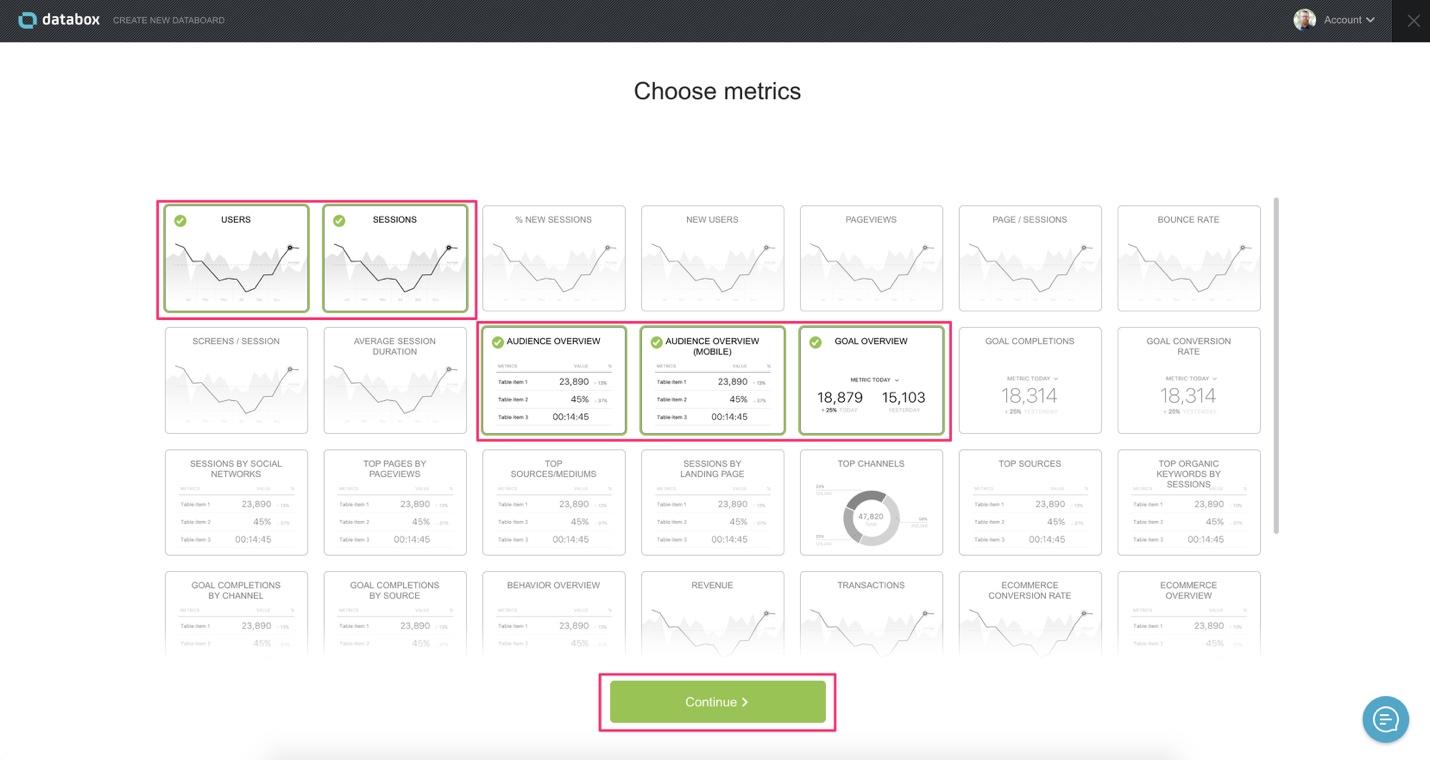
Next you want to select the metrics that you need to add to your KPI databoard. Once you’ve selected you metrics, hit “continue.”
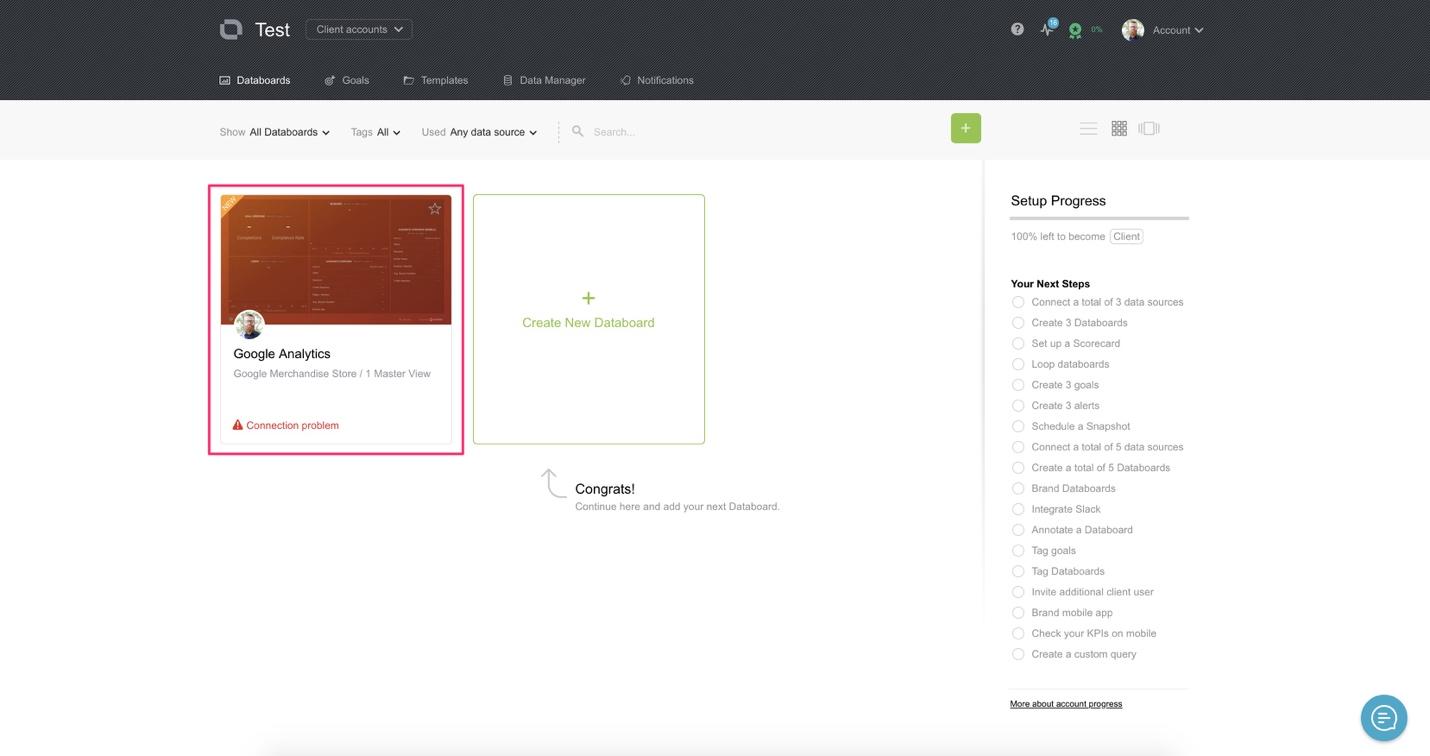
Databox will then configure you data into a databoard for you. Just like that, you know have a KPI dashboard! Just hover over the card and click the “edit” button.
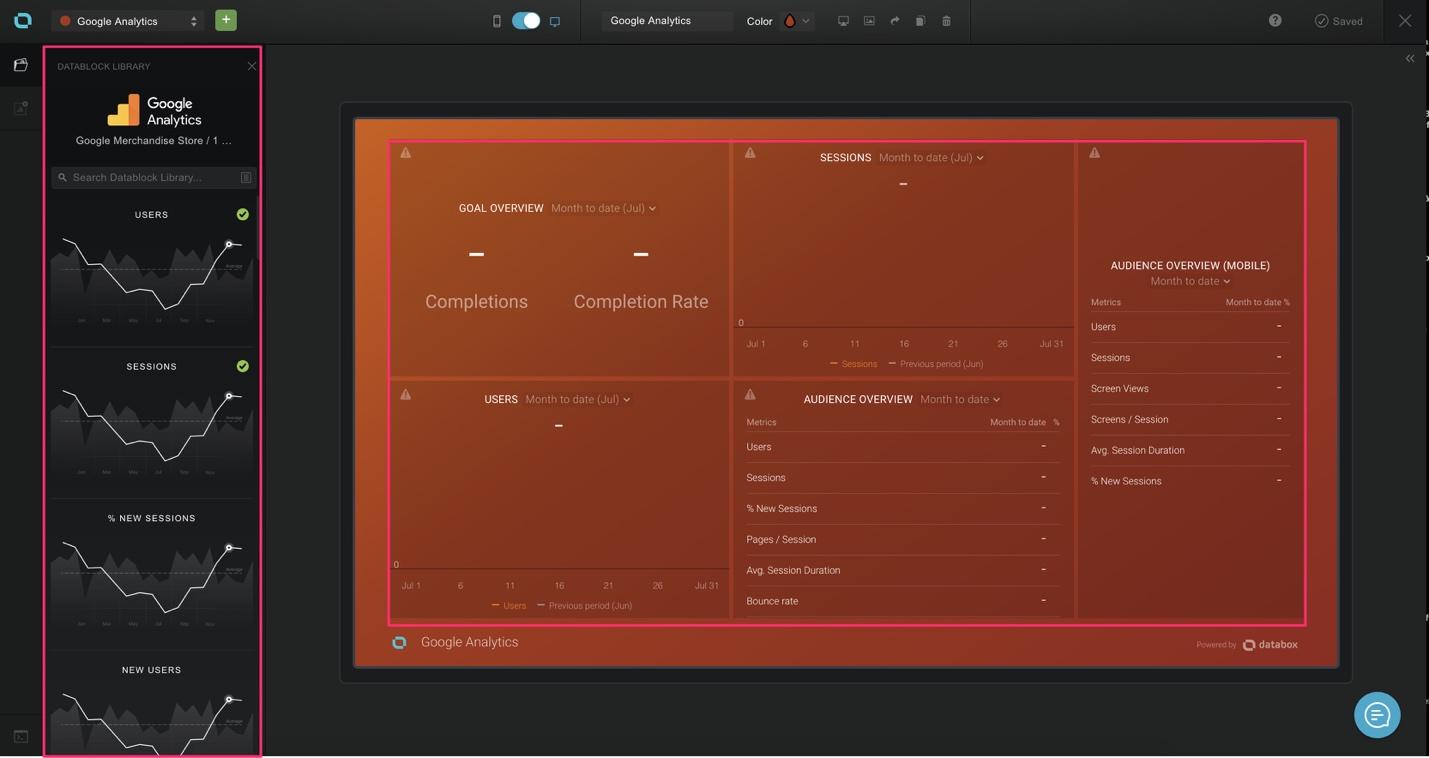
This is your KPI databoard. You can edit any of the boxes by clicking on them or add more data by dropping in one of the metrics located on the left hand slide. Let’s look at editing one of the metrics.
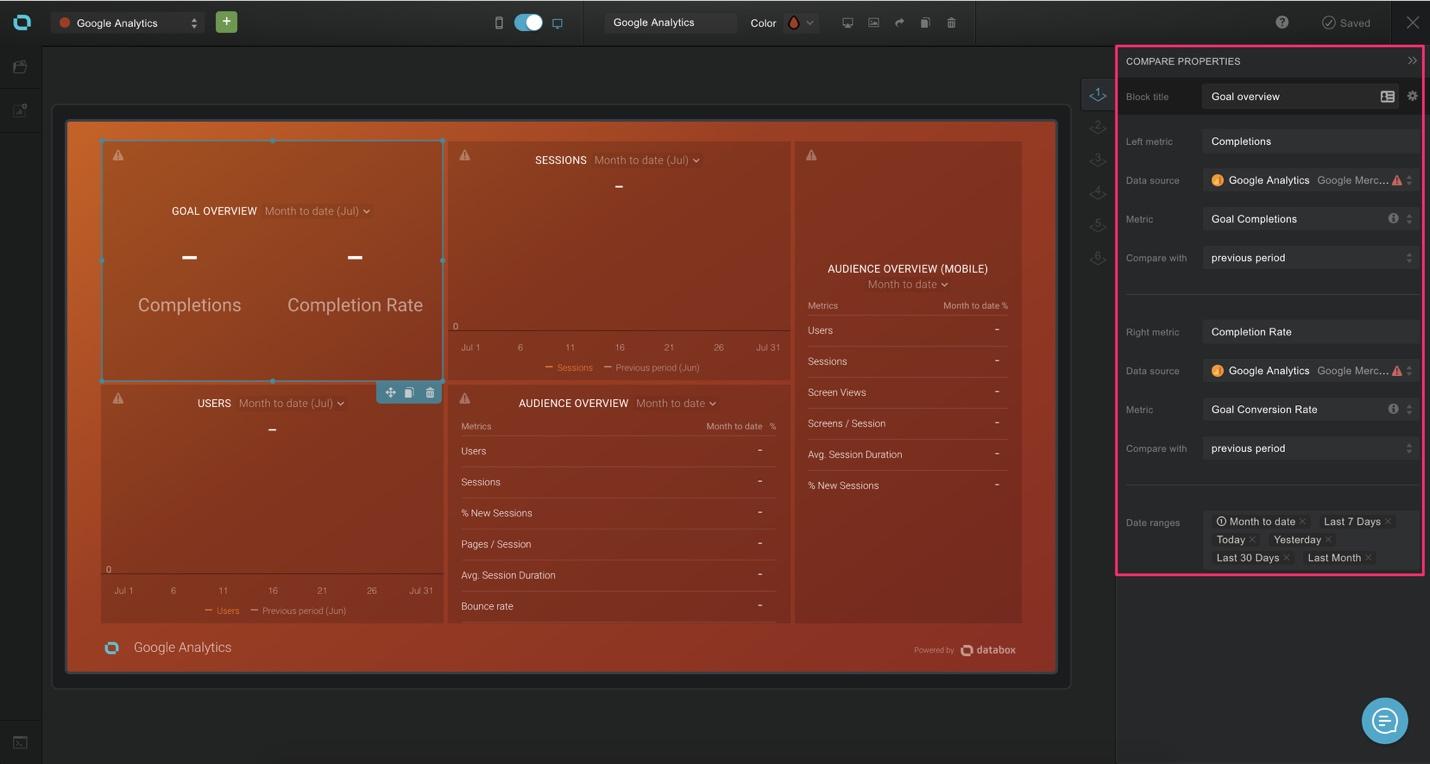
After clicking on a metric, a panel will slide out from the right. Here you can do the following:
- Change data source
- Change Metric
- Add comparison metric
- Change data ranges
- Connect a goal
This help make sure that your board meets you needs and actually helps you track your progress. Once you have completed making your basic adjusts, head back to your portal dashboard and let’s set up a scorecard. To do so, just click the databox logo in the top left corner.
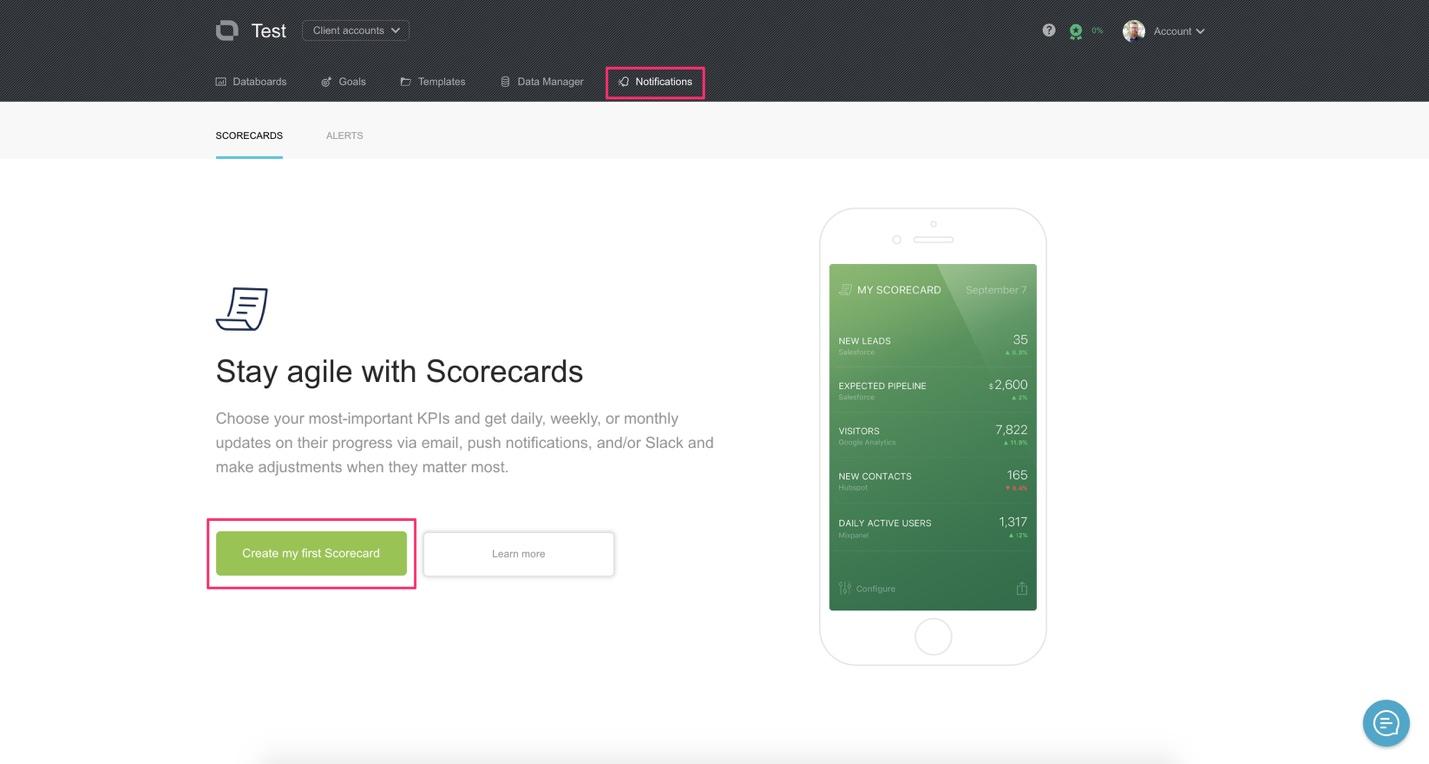
To create a scorecard, click “notifications” and then “create my first scorecard.” The goal of a scorecard is to give you a quick snap shot view of your KPIs.
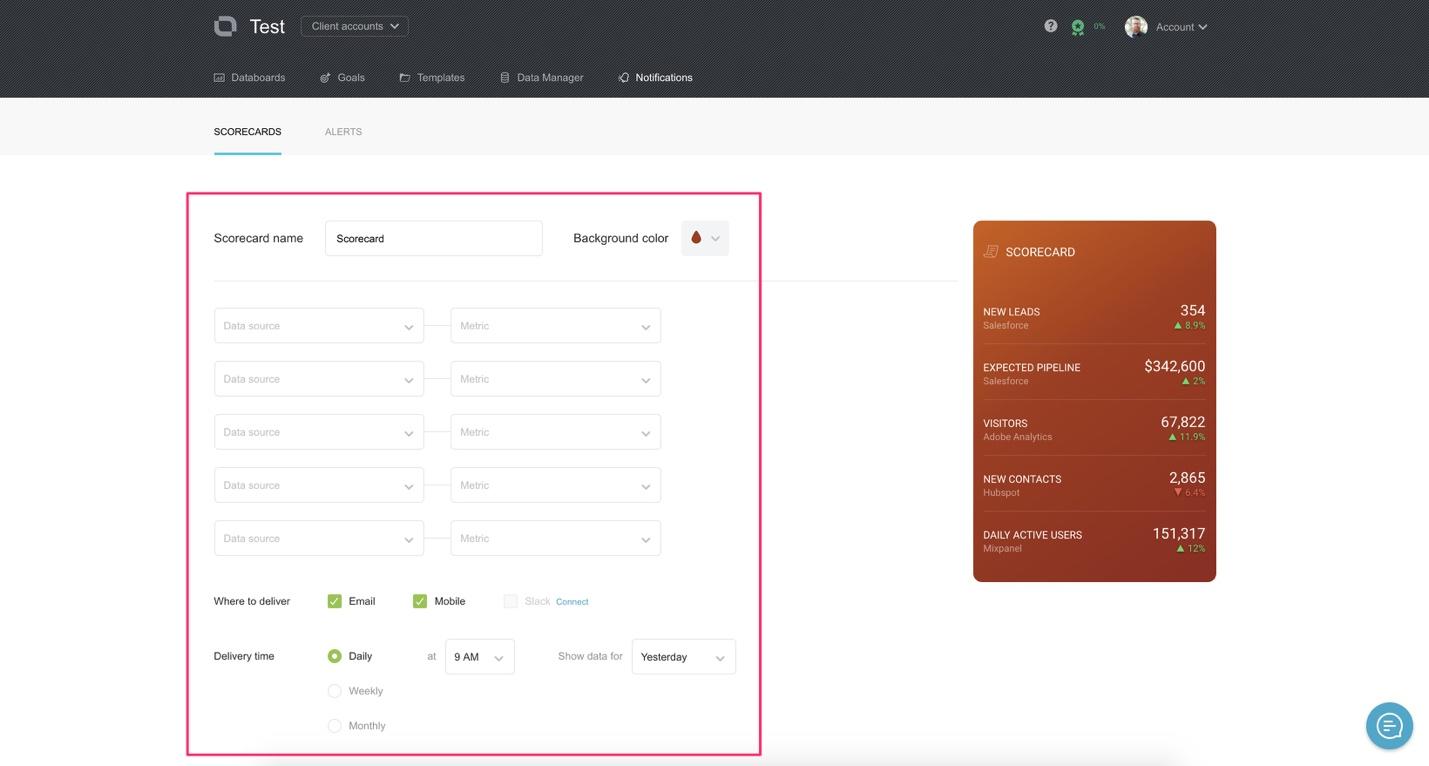
In the box, add your data sources and metrics you want to track. The set up where you want to see these scorecards. Databox has an app so you can take you metrics on the go with you. Download it here.
You then can set up how often you want to be alerted and when. I recommend checking your KPIs at least weekly. This will help you stay of top of your numbers and keep you focused.
Now that you are set up, go back and add a few more data sources and see what else you can create. We use databoards for every area of the business. We track marketing metrics, sales, finance metrics, user data and behavior, team productivity and of course KPIs.