
Testing is supposed to be straightforward and extremely transparent. It should be so easy to see the ROI – especially when compared to opaque stuff like SEO. But is it really so transparent as we’d like to think?
There are some uncomfortable questions about transparency, but we can answer them. In this post I’ll address the top five “uncomfortable questions” along with comments from fellow optimizers.
1. Is the lift still there?
You ran a test, and had a solid winner – the sample size was adequate, test ran for two business cycles, confidence level was above 95 percent – and the lift was like 10 percent. You’re confident in the result – and implement the winner on your site.
Now three, six, or 12 months go by. Is the lift still there? How would you know?
Let’s say your boss or client asks that question. What would you say?
You can’t rely on web analytics data – and just compare time periods – as everything changes. Your traffic sources, external environment, and so on – it wouldn’t be apples to apples comparison, too many uncontrolled variables.
Yes, re-testing may seem like the simplest option, but it might not be that straightforward. Testing something comes with an opportunity cost – it means you can’t test anything else. While I’m re-checking something here, I could be testing something else that might benefit me (though, of course, I can’t know for sure if it would). It’s also worth considering if re-testing is necessary.
Andre says you can’t know unless the test is running at all times:
 Andre Morys, Web Arts
You won’t know for sure unless you run the test for the entire duration. A test is an experiment, not the actual situation. We have to work with statistics, which means we have a certain likelihood that all our improvements will, on average, be close to the uplift we measured, but we can never know exactly how much.
It is the lack of maturity outside the industry that sets this kind of expectations. “I measured 10% uplift so I expect 10 percent more money on my bank account.” It is our job to change this expecations – that means we have to stop communicating stupid case studies.
Tim recommends you leave a stub running:
 Tim Ash, SiteTuners
A “win” is based on the assumption that the page visitor population does not change. If you are in a fast changing industry or your traffic mix changes, those assumptions may not be valid.
So we recommend to many of our testing clients to continue to run an ongoing back-test. For example, you run the winner 90 percent of the time (to get most of the financial benefit), and run the loser at the 10 percent level (to make sure that as a long-terms trend it continues to under-perform). If the “loser” starts to do relatively better, then it is time to take another look at the page and perhaps run some new tests.
The same idea is recommended by John:
 John Ekman, Conversionista
Leave a a small percentage of the traffic on your test after implementing the winner, just to see if the needle moves again. I would also advise this: create “testing slots” over the year, reserve one of those slots for re-testing. So in this period you go back in your testing log and re-test just to make sure your results are still valid.
Lukas thinks it’s pointless to ask that question:
 Lukas Vermeer, Data Scientist at Booking.com
If you want to know, a negative experiment, where you test B (now base) against the old A, will tell you that, but does it matter?
It’s only important if you have a reason to think that A might now be better than B. If they are equally good now, there’s no reason to switch back; you’d be wasting valuable testing time. Better to find C which beats both A and B!
Michael has an illustrative story about this question:
 Michael Aagaard, Content Verve
A while ago I was working on a major CRO project for a large e-commerce client. During the first 6 months of the project, I focused on the most critical steps in the conversion funnel – in this case, the main product landing pages and the checkout funnel.
The treatments were based on extensive conversion research and solid data-driven hypotheses. Moreover, all tests were run for a minimum of three business cycles and based on at least 200 conversions and a confidence level of 95 percent. So I was reasonably certain that my lifts were in fact real. In addition to this, we tracked everything closely in Google Analytics and we could verify that conversions, revenue, and sales were up and that the combined effect of all my work was a 21 percent lift in the overall conversion rate.
Nevertheless, a few months down the road, the conversion rate suddenly dropped like crazy, and the client started questioning whether I knew what I was doing.
I took this development very seriously and started to look for an explanation. Fortunately, it didn’t take much digging in analytics to spot the cause of the drop.
Without informing me, the client had run a banner campaign that generated over 30,000 new visitors in a few weeks and – get this – zero conversions (yep that’s right a campaign conversion rate of zero percent).
This obviously had a negative impact on the overall conversion rate and when I filtered out this unusually shitty traffic, the lift was still there. I had a meeting with the client and they understood that the drop in conversion rate was on their marketing blunder – not my CRO work.
If you run solid A/B tests that yield real lifts (not imaginary ones), you should be able to track these lifts down the road. If you can’t spot your lift after a while, you need to investigate which external/internal factors could be influencing the performance of your treatment.
Major changes in traffic quality are a likely malefactor. Changes to key points earlier in the conversion funnel are also very common (e.g. you optimized the checkout page and got a lift – but a month later changes were made to the landing page resulting in a surge in unqualified traffic).
Also – averages lie, so make sure you go into detail and understand the minutia of the datasets you are analyzing. This also means that you need to integrate test data with your analytics setup so you can get the full picture of how your treatment affects visitor behavior. I’ve run plenty of tests that increased conversion on desktop but decreased conversions on mobile. In such cases, going with average will in all likelihood lead to serious blunders and bad business decisions.
2. What’s the combined uplift for all the tests you’re running?
Let’s say you’re running tests on a large ecommerce site. You have multiple tests running at once: one on the home page, one on the product page, and one in the checkout.
Lets say that all tests product a confident lift. How would you know the combined lift? What will be the actual business impact after implementing the three winning variations?
If your boss or clients asks you to quantify / predict the impact, what would you say?
Lukas thinks it doesn’t matter as long all changes add value:
Lukas Vermeer, Data Scientist at Booking.com
If you want to know to the answer, you need to create a combined experiment, where you test base against all changes at once in a single experiment. That will tell you that, but does it matter?
Sounds like all changes add value; so why would you not apply them?
Remember: the size of the difference between A and B is probably irrelevant when deciding which variant should be on your site. Do you want to waste valuable testing time, just so you can write fancy reports that show exactly how much money you lost getting the data for the report by exposing traffic to a losing variant while you already knew the winner?
How badly do you need that report? How much money are you willing to spend on an exact number?
John agrees:
John Ekman, Conversionista
I would say don’t even bother trying to speculate, calculate this. If we use the Growth hacking lingo – An AB-test is a “validated learning”, not something you send to the accountants. Organizations who are trying to hardwire test methods built on statistical models with accounting (built on allocation, tracking, auditing) are barking up the wrong tree.
You should listen to the Conversion Buddha – ”You must not become attached to your data”. Use your energy on something more important.
Tim also recommends a combined test:
Tim Ash, SiteTuners
You can run a quick A/B back-test: the original home/product/checkout pages versus the new home/product/checkout pages. That way you will see the end-to-end effect on sales, and can take all of the interactions among the three page types into proper account.
Andre says you need to change the way you run multiple tests at once:
Andre Morys, Web Arts
You should separate your traffic in different buckets so you can measure each test without influence. If you mix the test traffic you get in statistical trouble because you have something like a non-segmented multivariate test.
Depending on the amount of conversions you have, this destroys your significance completely although the tool says you have an uplift somewhere. You need a lot more of traffic until this phenomenon stops.
3. So what’s the actual business impact over the last 12 months?
Let’s say you’re working on optimizing a site, and have been for the last six or 12 months.
You’ve had solid winners each month – you’re absolutely confident in the test results. Six months later the conversion rate is still the same. Now your boss / client comes to you and asks: How can you sum up the progress you’ve made?
This is a very uncomfortable question. How can you justify your contribution (and cost) when your KPIs are flat?
What would you say?
I know people that flat out tell their clients that it’s not possible.
The thing is that tracking progress is hard as your metrics are in constant movement. You can’t just check what the conversion rate or revenue per visitor were six months ago, and compare it to now. Everything is in constant movement.
Andrew chimes in with a detailed explanation:
 Andrew Anderson, Head of Optimization at Malwarebytes
It can be extremely difficult to explain results when it looks like things are flat or overall down. The fundamental problem is that people are using a linear correlative data set instead of the comparative data that a test provides, or in other words you are saying that you are X percent better, not necessarily X percent better of a specific numbers. All data is sinusoidal, it goes up and it goes down, despite test results.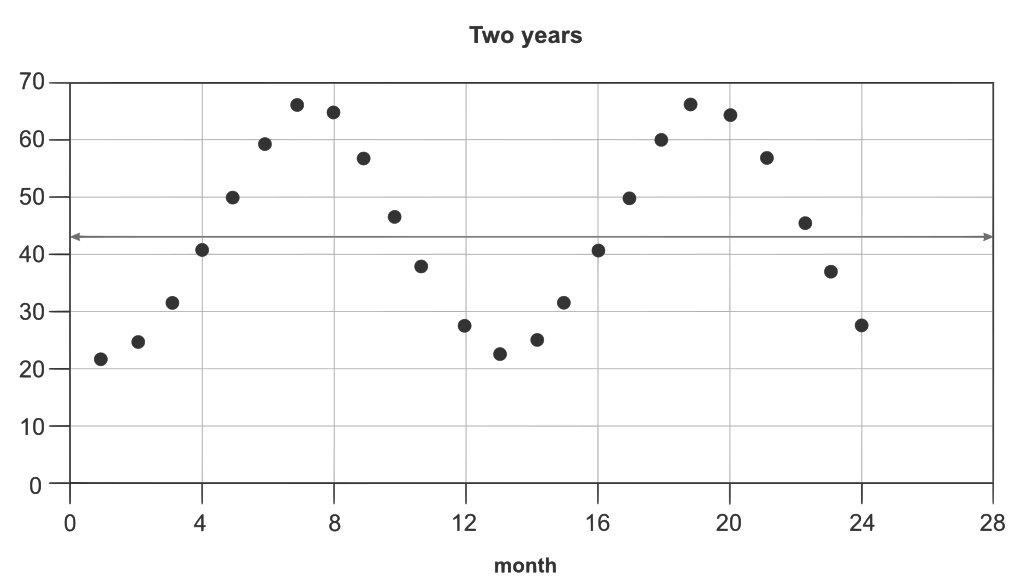
If you are on the way up then you could easily have a negative outcome and end up with a higher total number then where you started. You are lower than where you should be but still higher as an absolute measure. Likewise if you are on the way down you can end up lower but still be significantly better then where you would have been. It is also important to express impact as a range and not an absolute number. I try to make it clear that when I say something is X percent better, it is really .5 times X to two times X better, and expressing that impact in real numbers. It is just as likely to be more as it is to be less.
That being said, you should be more concerned with the impact to the bottom line than others and should be the first one to question the real impact of your actions, else you are liable for confirmation bias as much as anyone else. Some of the easiest ways is to retest old versions as part of larger tests much later on, or to use weak causal analysis to get a read on estimated impact. In both cases you will often find that you are actually having a bigger impact then you imagine. It is important that you are doing this analysis without prompting and proactively giving others a full evaluation of the overall program.
I ran into this problem in one of my past jobs where I was driving a massive gain in performance for the site but overall numbers continued to go down. After five months of continual optimization and an estimated impact of about 120 percent increase we decided to include the original design of the site as part of a larger test. What we found was that the actual impact was actually 257 percent better and that what was really driving down performance was an SEM approach of pushing for quality leads over all leads, dropping overall performance. This lead to eyes being diverted from blaming the testing program and instead a re-evaluation of the SEM program, while at the same time really granting the optimization program unlimited access to changing the user experience.
Explanation Of Weak Causal Analysis: Do a long term trend line with an estimated error rate. Take that based on prior data before the change and look at the outcome as compared to the expect outcome of the trend line. Make sure you are using independent variables as a basis (like users) so that you can get some read on where you would have been versus where you are.
Not perfect, but better than nothing.
Andre says you can only spot big lifts in the linear data:
 Andre Morys, Web Arts
We always think that our tests are completely isolated – that is not true. This is also a reason why most of the formulas inside the tools are wrong. You can see how the environment impacts test results even while you are running a test (TV campaigns, newsletter-traffic, competitors marketing campaigns, etc.).
If you have great test results with big uplifts you will see the lift in the linear data. But that means a really big uplift. Everything around 5-10 percent will be hidden inside the noise of the data.
Lukas says that if you REALLY want to know the impact of your last six months of optimization work, there is a way.
Lukas Vermeer, Data Scientist at Booking.com
If you really want to know, you can do that by sending a small fraction of all traffic to a consistently stable base, which never changes, will tell you how much better your site is performing now than it was before.
Usually this is technically difficult, but might be needed to shed light on the cost of inaction/not testing.
John advises to be careful about “conversion rate”:
John Ekman, Conversionista
To be honest “Conversion rate” is a BS metric. It’s just a sloppy average impacted by tons of factors. Like Bryan Eisenberg says -“Knowing you conversion rate is like knowing your temperature when you’re sick. It won’t tell you what’s wrong.”
4. Did it really win?
You had a winning test, but after implementing the winner, you don’t really see the lift in the analytics numbers. Did it really win?
The obvious thing to suspect here is that there was no lift to begin with. It was imaginary. Perhaps your sample size wasn’t big enough, you didn’t test long enough. Statistical significance does not equal validity.
Andre concurs, and adds that you won’t see the lift unless it was a big lift:
Andre Morys, Web Arts
The winner need a really significant uplift to stand out of the noise. If it had that kind of uplift (let’s say 20%) you should see it. If you did not see it, you measured wrong.
In my opinion, 90 percent of all test results are measured wrong because people care not enough about statistics and proper market research. You always nee a representative sample and in most cases this means your test should run for at least two to four weeks. Everything else is bulls**t.
John warns against false positives:
John Ekman, Conversionista
If you’re running at a 95 percent confidence level you still have 1 chance in 20 that the lift didn’t actually happen. If you need to be more sure – retest. Otherwise move on, you probably have more areas to discover.
Lukas recommends a re-test if you have a reason to doubt the result:
Lukas Vermeer, Data Scientist at Booking.com
Analytics numbers over time are not reliable, because there are many other factors that may influence them. If you suspect you test was a false positive, rerun the experiment.
5. What’s the impact of your test on customer lifetime value?
You’re optimizing a SaaS website with monthly recurring payments. Let’s say you had a winning test – and get more paid signups. But how can you be sure that churn won’t increase for those? How can you take CLV into account when running tests and calling winners?
Your typical testing tools won’t allow you to run this test with ease, so you need to store experiment data in the system along with other signup info (email, login, password, chose plan, etc). Most testing tools are cookie-based, so you can pull information from the cookie, and store experiment ID + the variation number (or if they were part of multiple experiments, store all of that) and save in the backend along with other user data.
Andre recommends this exact approach combined with cohort analysis:
Andre Morys, Web Arts
You need to do a cohort analysis. This is easy to do by transferring the data about test ID, variation number etc into the backend (CRM), so you can later analyze customer variables segmented by tests and variations.
John says the same thing:
 John Ekman, Conversionista
Cohort analysis, follow the different test segments over time and try to connect the different testing points in the customer journey to CLV.
Will take time a lot of time. Be patient.
Lukas says you should pick the winner based on the right metric:
Lukas Vermeer, Data Scientist at Booking.com
Pick the right metric.
This question is not about testing strategy, but about business objectives. If your business relies on repeat payments, conversion rate is probably not the right metric to optimise for; just like CTR is terrible for optimising hotel bookings (e.g. EMK with subject “FREE BEER” will improve CTR, but probably reduce sales once customers figure out there is no beer on your site, certainly not free beer).
You should probably look at more longer term metrics, such as signups that stay customer for three months+.
Conclusion
These uncomfortable questions come from the right place – you want to KNOW, but it’s often overshadowed by ignorance. Make sure you know what to say, so you won’t kill faith in optimization in the eyes of your client or boss. If you don’t know how to answer these questions, you’ll inevitably lose some credibility.