 Imagine this scenario: You are the manager of a contact center who is responsible for monitoring KPIs, training, upholding your organization’s policies and standards and staffing. Your budget is squeezed forcing you to think of creative ways to stretch your dollars further. You know that for every hour your agents are sitting at their desks without inbound or outbound calls you may as well be throwing money down the drain. Sure you can let some agents leave early if it’s a slow shift, but what if your center is suddenly overwhelmed with a spike in call volume? If this happens you know your KPIs will look terrible, but you also can’t afford to have agents on the clock without any work to do. If only there were some way to predict when your call volumes would be high or low and the nature of the calls so you could staff the right agents with the appropriate expertise.
The great news for contact center managers and executives is there is a way to predict the peaks and valleys of call volumes. Data analytics and visualization software, while not new, has evolved over the years to be of great benefit to contact centers, particularly its predictive analytics capabilities.
As anyone who has worked in or with a contact center can tell you, a large amount of data is generated on an hourly basis. Trying to make sense of all the data and knowing what to do with it can be overwhelming.
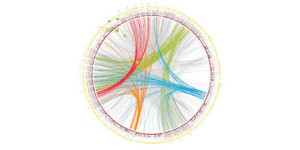
One way that managers avoid “information overload” is to know which KPIs they need to focus on and pay attention to the data that are relevant to those performance indicators and ignore the rest. The problem is that by focusing on only a certain set of numbers and dismissing others is that your view of your contact center may become myopic. Often the data are interconnected and to really understand your call center you need to have a broader view. This is where analytics software can help. Managers can easily manipulate the data and convert it into various visual representations, i.e. graphs, pie charts, reports, and interactive dashboards. It can be argued that without the tools to help interpret big data, companies may lose out on understanding the patterns that affect their overall business processes and thus fail to create better outcomes and customer experiences.
Let’s take a hypothetical look at how predictive analytics could help your contact center predict and proactively respond to issues before they even arise.
The Challenges
- Your contact center is inundated with calls and you can’t figure out the cause of the sudden escalation.
- Because you don’t understand when call volumes may be higher or lower you don’t have the right expertise on hand to support the types of inquires coming into your system.
The Solutions
- With data analytics and visualization software you can correlate the problem tickets to processes, events, geography and other demographic information.
- When detailed analysis on incoming call data is run through analytic and visualization software, managers can better predict escalations and be alerted to early warnings of when issues may escalate.
The Impacts And Results
- By converting big data into visual representations that are easy to interpret, managers will have a better sense of trending call types and critical issues.
- Being able to predict when issues may arise allows managers to take preemptive actions.
- With a better understanding of what the data means, training can be targeted and tailored to the actual issues facing the agent.
Depending on how elaborate you want your analytics software to be, there are now a number of companies making data visualization available without a huge capital investment. A few companies such as Tableau Software, Qlick, Cisco and IBM have created data visualization and analytics software that is less costly, intuitive to use and less infrastructure intensive, thanks to cloud technology.
If you are convinced that analytic and visualization software is right for your company, keep in mind that as with any new technology, having a strategic plan before implementation is crucial to its success. Particularly with software that is designed to interpret data into usable formats, you’ll want to pay special attention to the how information is input so the output is relevant. Think of the old adage “garbage in, garbage out.” When appropriately implemented, analytic and visualization software can be a great tool in helping your contact center meet its objectives.