As a versatile analytical tool, cross-sectional analysis provides a quick snapshot of various business phenomena, such as market trends, customer preferences, and competitive dynamics. Armed with these insights, business owners, managers and investors alike can make well-informed decisions that promote growth and resilience.
Whether you’re exploring new market opportunities or seeking to understand your customer base better, cross-sectional analysis is an excellent starting point. Dive in as our experts at Business2Community break down this technique and highlight its real-world applications, ensuring you can leverage it for your own strategies.
Cross-Sectional Analysis – Key Takeaways
- Cross-sectional analysis is a snapshot of a particular group or variable at a given point in time.
- It uses cross-sectional data to explore the characteristics of a population or sample over a short period and typically lays the groundwork for further research.
- While a cross-sectional study measures the characteristics of study groups or variables, it should be integrated with other tools to reveal causal relationships, trends, and more.
What is a Cross-Sectional Analysis?
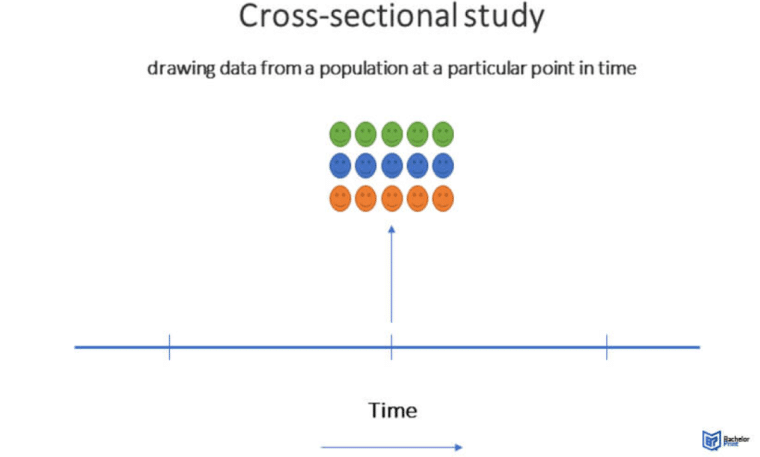
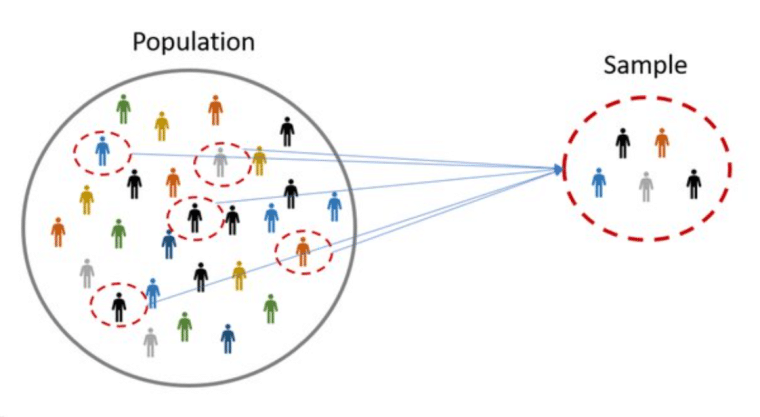
A cross-sectional analysis is a type of observational study used to analyze data from a population or a representative sample at a single point in time. In a cross-sectional study, participants or variables are selected based on a particular point of interest. These variables are then investigated to describe various characteristics or provide preliminary data to support further research and experimentation.

Who Needs to do a Cross-Sectional Analysis?
Anyone who wants to understand different variables at a single point in time likely needs to do a cross-sectional analysis. Because cross-sectional designs allow you as a researcher to form assumptions or research questions and test your hypotheses using a variety of research methods, it has wide applicability across fields such as economics, psychology, medicine, and social sciences.
In the health sector for example, cross-sectional studies can be used to gather large amounts of information from a large pool of participants and examine the prevalence of a particular illness or health outcomes at a point in time.
Meanwhile, in business contexts, cross-sectional studies can be used by business owners, functional managers, decision-makers, and investors to:
- Provide a cross-section of financial data for comparisons and insights across businesses and industries.
- Analyze consumer purchasing behavior and market trends to guide product development, marketing strategies, and market expansion.
- Optimize business performance, strategic decision-making, and investment decisions.
- Improve operational efficiency, identify risk factors, and guide resource allocation.
Cross-Sectional Studies vs Longitudinal Studies
A cross-sectional study provides insights into data at one point in time. In contrast, a longitudinal study analyzes data across an extended period to track variable changes over time. Additionally, while cross-sectional studies often involve many subjects, longitudinal studies examine the same subjects but in smaller sample groups.
How to Perform a Cross-Sectional Analysis
Let’s dive into a simple 8-step process to perform a cross-sectional analysis:
Step 1: Determine Your Objective
Start by clearly defining what you want to achieve with your analysis. For example, you might want to benchmark business performance against competitors or investigate consumer characteristics, interests, and attitudes.
Step 2: Determine your Study Population or Sample
Selecting the right study population is the foundation of your research. Unlike in case-control studies or cohort studies, participants in a cross-sectional study are selected based on the inclusion and exclusion criteria that you set for your study. This could be a specific demographic of customers, a particular market segment, or an industry sector. If your study population is massive, you can choose to determine a large, representative sample through random sampling.

Step 3: Collect Cross-Sectional Data
Collect data for your study population or sample. Your data collection methods will depend on your research objectives and the nature of the data you want to collect. However, common data collection methods include:
- Cross-sectional survey or questionnaire: Best for collecting data on attitudes, behaviors, and opinions from a large number of participants.
- Interviews: Ideal for capturing in-depth qualitative data, exploring complex topics, or gathering detailed information.
- Secondary analysis: Great for leveraging pre-existing internal and external data sources such as industry reports, financial statements, public datasets, or previous research findings.
Step 4: Perform the Analysis
To analyze the data collected, do the following:
Compile Descriptive Statistics:
Descriptive methods summarize your data, enabling you to understand the central tendencies, spread, and distribution of your variables. Common descriptive statistics include:
- Mean: The average or typical value of your data set is calculated by summing all values and dividing by the number of data points.
- Median: The middle value in your dataset when all values are arranged in ascending order.
- Mode: The value that occurs most frequently in your data.
- Standard Deviation: Measures the variability of your data or its dispersion around the mean.
- Frequency Distributions: Graphical representations that visualize the distribution of your data.
Calculate Prevalence:
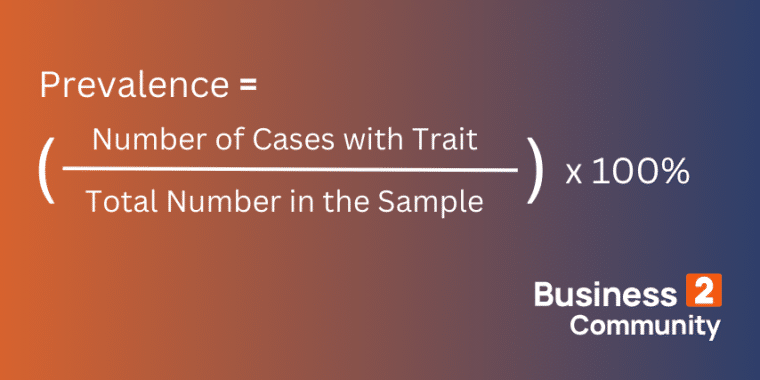
Prevalence is the percentage of cases in your sample or population that exhibit a particular trait or condition. Calculating prevalence is essential for understanding the magnitude and significance of a particular issue within your target population.
The formula for prevalence is:

Conduct Subgroup Analysis:
Subgroup analysis involves dividing your data into smaller groups based on specific traits to reveal differences and determine prevalence rates. To conduct a subgroup analysis, start by identifying relevant subgroups, such as age groups or geographical locations, for meaningful comparison. Then, use statistical methods to investigate variations in your data.
Step 5: Draw Conclusions
Interpret the results of your analysis in relation to your objectives or research questions. Finally, use the insights to make informed business decisions, refine your strategies, enhance operational efficiency, or adjust strategic plans. You may find that a particular age group cancels their subscription to your service in the first three months, so you can find ways to demonstrate its long-term value, for example.
Example of Cross-Sectional Analysis
A fast-food chain would like to assess the local dietary habits and calculate the prevalence of certain dietary patterns.
Objective: To evaluate the frequency of fast-food consumption and dietary preferences in the local area.
Study population: Residents of the city where the chain intends to open a new branch.
Sample: 10,000 randomly selected residents.
Data collection method: Online survey
Some descriptive statistics from the survey reveal that:
- 5,000 respondents report eating fast food at least once a week.
- 2,500 respondents prefer vegetarian options.
- 7,500 consider healthy eating important.
Prevalence calculations are used to analyze the data further:
Prevalence of Weekly Fast-Food Consumption
- (Number of people eating fast food weekly / Total sample size) × 100%
- (7,500 / 10,000) × 100% = 75%
Prevalence of Preference for Vegetarian Options
- (Number of people preferring vegetarian options / Total sample size) × 100%
- (2,500 / 10,000) × 100% = 25%
Prevalence of Valuing Healthy Eating
- (Number of people considering healthy eating important / Total sample size) × 100%
- (5,000 / 10,000) × 100% = 50%
Conclusion and Business Application:
A significant share of the population (75%) consumes fast-food weekly indicating that there is demand for the chain’s offering. Additionally, there is a notable interest in healthy options (50%) and vegetarian options (25%).
Based on the insights gathered, the company prioritizes marketing strategies that appeal to health-conscious customers. The chain also considers introducing more vegetarian options to its menu. To monitor and adapt to changing customer preferences, the company also decides to incorporate a serial cross-sectional study (data collection in the same study population at different time points) biannually.
When to Use Cross-Sectional Analysis
Below are three key scenarios where using cross-sectional analysis can be particularly beneficial for your business:
Benchmarking Performance
Cross-sectional analysis provides a quick and easy way for your business to benchmark performance metrics like revenue, profitability, and efficiency against similar companies in your industry. This allows you to identify areas of improvement and potential competitive advantages.
For example, an ecommerce store could use cross-sectional analysis to compare its sales growth and customer satisfaction levels with those of its competitors to enhance its market position.
Guiding Investment Decisions
Cross-sectional analysis plays a pivotal role in guiding investment decisions. By analyzing the performance of different markets at a specific time, you can identify the strategic risk or rewards associated with various strategic decisions.
A stock trader wanting to invest in a particular company could use cross-sectional analysis to evaluate similar purchase decisions and the potential financial outcomes or strategic benefits of such an addition to their portfolio.
Informing Business Strategies
Cross-sectional analysis is an indispensable tool for identifying patterns and trends in key business areas at a specific point in time. It can highlight trends in consumer behavior, business operations, or market dynamics that are critical for strategic planning.
For instance, a media company like Netflix might use cross-sectional analysis to examine the viewing habits of different demographics across various regions to inform the type of content it invests in and the languages that are successful.
How to Adjust a Cross-Sectional Analysis
To adjust certain aspects of your cross-sectional analysis and improve its outcomes:
- Focus on identifying the right target population and selecting a large sample size – smaller sample sizes may reduce your study’s accuracy and credibility.
- Use high-quality data and ensure that cross-sectional surveys are well-designed to ensure your study’s relevance and business impact.
- Acknowledge the limitations of a cross-sectional study, such as its inability to establish causality, and address them for more useful results.
Since a cross-sectional analysis is a snapshot in time, once you have adjusted your strategy or implemented a decision, you can continue to analyze data each quarter or year, for example. This will let you see if you have adjusted your analysis in the direction you had planned to.
Limitations of Cross-Sectional Analysis
While cross-sectional designs offer a valuable snapshot of data, they can’t tell you how data collected behaves over time. For a comprehensive understanding of a population and trends that might not be apparent in a cross-sectional snapshot, combine them with time series analysis.
Another limitation of a cross-sectional design is that it does not reveal causal relationships. For example, while cross-sectional studies can provide information on things like how common a disease is, they can’t determine the cause of a disease or what the best treatment is.

To reveal cause-and-effect relationships between different variables, integrate the following into your analysis:
- Chi-squared test: Assesses associations between categorical variables and helps determine whether a significant causal relationship exists between two or more categorical variables.
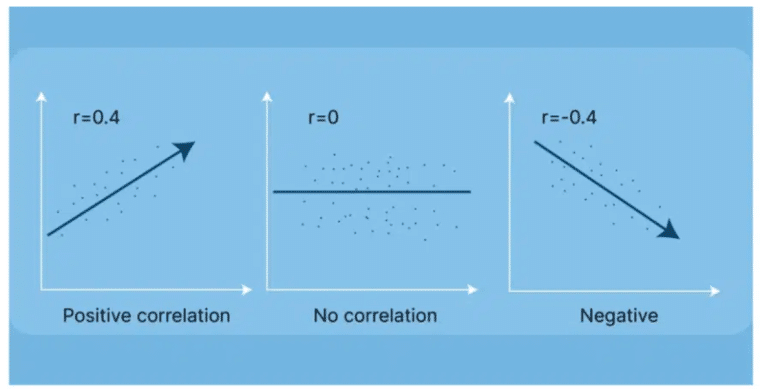
- Correlation Coefficients: Correlation analysis tools such as Pearson’s correlation coefficient or Spearman’s rank correlation can help quantify the strength and direction of relationships in continuous variables.

The Value of Cross-Sectional Analysis
Cross-sectional analysis is a powerful tool for unlocking insights about a market, industry, or consumer segment at a specific point in time. Its value lies in its versatility and adaptability across various contexts such as business, health, and economics. However, it’s not without its limitations.
To address limitations like its inability to determine causality, combine cross-sectional analysis with correlation analysis to determine the magnitude of causal effects on your variables of interest. For insights that extend beyond a given point and reveal key trends, incorporate time series analysis into your research.
In an ever-changing marketplace, cross-sectional analysis can be a valuable addition to your business intelligence efforts. Leverage it to understand current trends, benchmark against competitors, identify areas for improvement, and ultimately, drive more positive business outcomes.
